Home Accessibility

ACCESSIBILITY

Accessible Data Visualization, by Design

A chart that only works for people who can see it and use a mouse leaves people out. Every experience we build can be used with a keyboard alone, read by a screen reader, and explored as plain text.

THE LAW IN ONTARIO

Why it matters in Ontario

Ontario's Accessibility for Ontarians with Disabilities Act (AODA) requires public sector organizations and businesses with 50 or more employees in Ontario to make their websites and web content meet WCAG 2.0 Level AA. We build to WCAG 2.1 AA, a newer and stricter standard, so your visualization does not become the part of your website that fails an accessibility review.

AODA requires

WCAG 2.0 AA

Public sector organizations and businesses with 50 or more employees in Ontario.

We build to

WCAG 2.1 AA

A newer and stricter standard.

IN PRACTICE

What that means in practice
A text equivalent for every visual

Each visualization has a List or Table view with every record, searchable and sortable.

Full keyboard access

Tab to every control, arrow keys to move between items, Enter to open a record, Escape to close it.

Screen reader announcements

When a view, filter or selection changes, a screen reader says what changed.

Visible focus

You can always see where you are on the page.

Contrast

Text meets at least 4.5:1 contrast. Colours that need to be told apart also differ in lightness, not hue alone.

Reduced motion

If your device asks for less motion, the animation stops and views change instantly.

No plug‑ins, no logins

It runs in any modern browser on desktop or mobile.

TRY IT YOURSELF

Put the mouse away

Open the live grants example and press Tab. Everything on this list works from the keyboard.

Open the live example

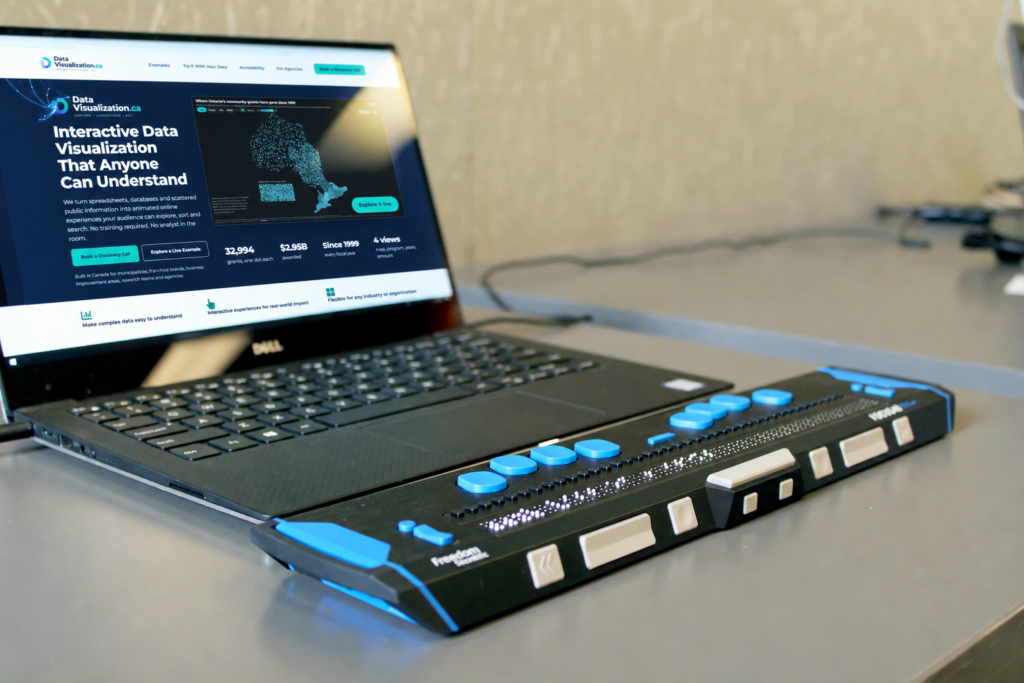
A laptop next to a refreshable braille display, a device that turns on-screen text into braille a person reads by touch.

Photo: Elizabeth Woolner, Unsplash

HOW WE CHECK IT

How we check it

01

On every build

Automated WCAG 2.1 A and AA checks run on every build of every visualization.

02

Before launch

A manual keyboard and screen reader pass.

Ready to Make Your Data Easy to Understand?

Tell us about your data and who needs to understand it. We will show you what an interactive experience could look like and what it takes to build it.