LIVE EXAMPLE - OPEN DATA

Every storefront business in the Downtown Yonge BIA

Three City of Toronto open datasets, joined: business licences, official address points and BIA boundaries. The result is a living picture of the district, with every storefront business placed at its official City address.

The interactive opens on click. A second view shows the 368 food premises inspected by DineSafe.

348

active storefront businesses

3

licence types

187

on Yonge Street itself

368

food premises in the DineSafe view

What the data reveals

FOOD LEADS

86% sell food or drink

Take-out and retail food (157) and eating or drinking places (142) make up 299 of the 348 businesses. Personal services account for the other 49.

ONE STREET CARRIES IT

54% are on Yonge Street

187 of the 348 businesses have a Yonge Street address. Bay Street is next with 48.

NO GUESSING

Placed at official addresses

Each business is matched to the City's own address point by street number and street name. Nothing is geocoded. Across the city, 19,574 of 20,932 active storefront licences (93.5%) match exactly.

A SECOND LENS

368 food premises, 62 streets

DineSafe, the City's food inspection data, lists 368 premises inside the BIA, 154 of them on Yonge Street. It counts inspected premises, not licences, so the numbers differ by design.

INTERACTIVE

How to explore it

By licence type

Regroup every business by what it is licensed to do.

Light up a type

Select a business to highlight the others with the same licence type.

Search

Find a business by name.

Every business, as text

List view is a searchable table of all 348 businesses.

About the data

Source: City of Toronto Open Data - Business Licences, Address Points, Business Improvement Areas and DineSafe, published under the Open Government Licence - Toronto. Not affiliated with or endorsed by the City of Toronto or the Downtown Yonge BIA.

  • Active storefront business licences inside the BIA boundary, placed at their exact City address point.
  • No address was guessed. Licences without an exact match are not placed.
  • The DineSafe view is a separate dataset of inspected food premises.

Show what makes your district worth joining

A living picture of your area is a far stronger pitch to new members and funders than a static annual report.

More examples

Map of Ontario made of dots, one for every Ontario Trillium Foundation grant since 1999, coloured by year. Southern Ontario is densest; 2,325 province-wide grants sit in a labelled group beside the map.

Ontario community grants since 1999

32,994 Ontario Trillium Foundation grants, one dot each, on the map of Ontario.

See the grants example

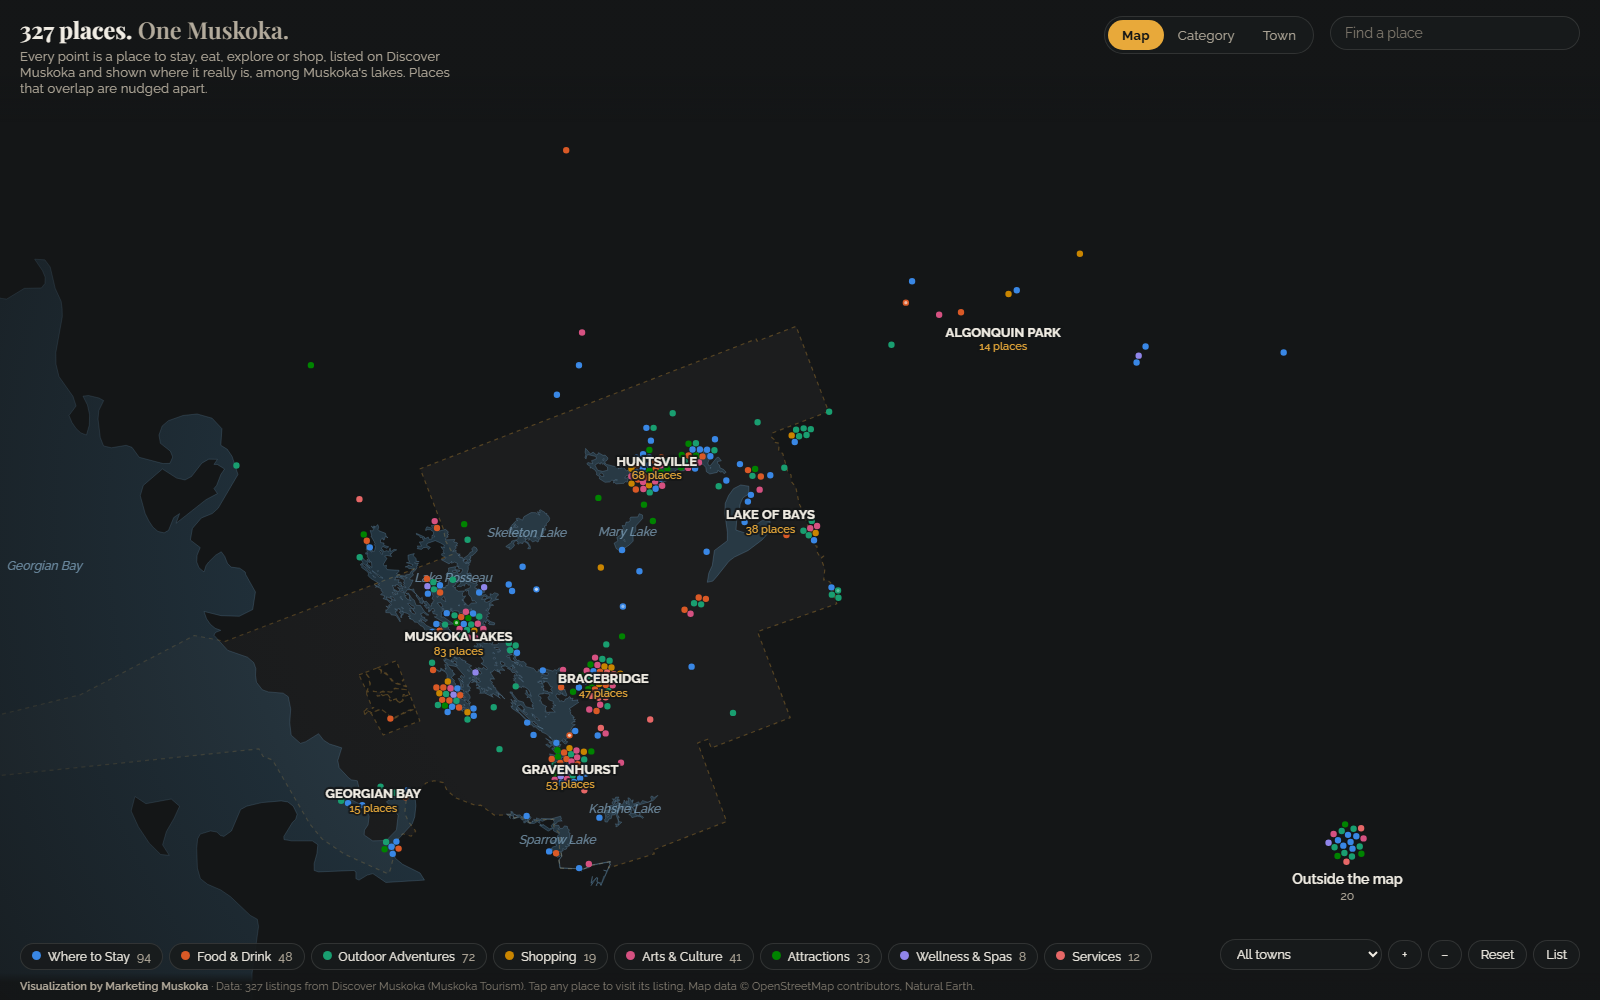
Map of Muskoka with coloured dots for tourism listings placed among the real lakes, grouped by town: Muskoka Lakes, Huntsville, Gravenhurst, Lake of Bays and more.

Muskoka tourism

Muskoka's tourism listings on a real map of its lakes, each placed by its own listing's coordinates.

See the tourism example

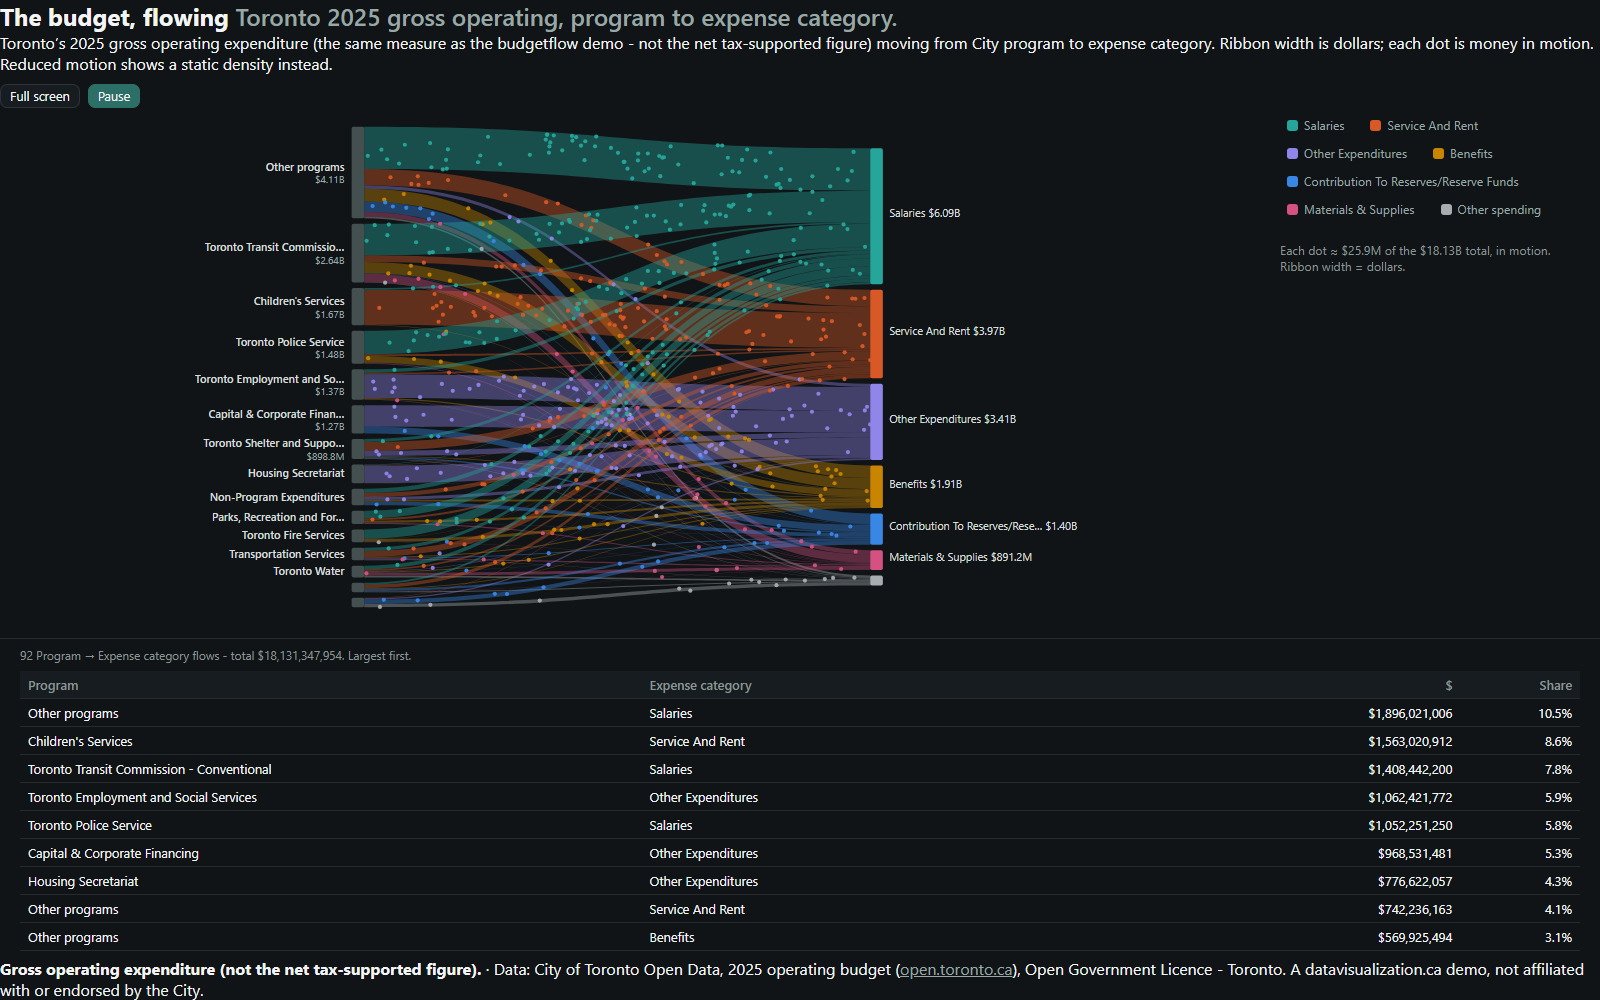
Flow diagram: Toronto's 2025 gross operating budget moving from 15 program groups on the left to 7 expense categories on the right. Salaries is the widest stream at $6.09B.

A city budget, in motion

Toronto's 2025 gross operating budget, flowing from City programs to what the money is spent on.

See the municipal example