Home Industries Economic Development Organizations

INDUSTRIES

Data Visualization for Economic Development Organizations

We turn labour force, trade, business and site data into interactive maps and stories that investors, site selectors and council can explore on their own.

THE CHALLENGE

Make the case for your region in seconds

Site selectors and investors compare dozens of places before they ever call. They want labour force, wages, commuting, trade, available land and key employers, and they want it fast. Most regions hand them a PDF profile and a list of links.

An interactive profile answers their questions in seconds, on your own website, and shows exactly why your region belongs on the short list.

TODAY

  • Community profiles published as long PDFs
  • Labour and trade data scattered across sources
  • Site selectors asking the same questions every time

WITH AN INTERACTIVE VISUALIZATION

  • One interactive profile of your whole region
  • Investors find their own answers in a click
  • Open to everyone, WCAG 2.1 AA

Questions investors and site selectors ask

WHAT WE BUILD

What we build for economic development

Investment profiles

Labour force, wages, education and key employers in one explorable profile of your region.

Available sites and land

Every site on a real map with size, zoning, servicing and distance to highways, rail and ports.

Trade and export flows

Where your goods go and what they are, from Statistics Canada trade data.

Labour shed and commuting

Where your workers live and how far they travel, from Census commuting data.

Business directories

Your business inventory as a searchable map, by sector, size and location.

Branded investor reports

Site selectors download a branded PDF or PowerPoint of the exact view they are exploring.

LIVE EXAMPLES

See it working

Live examples built from real Statistics Canada and municipal data, the same sources investors use. Every number comes from the published source.
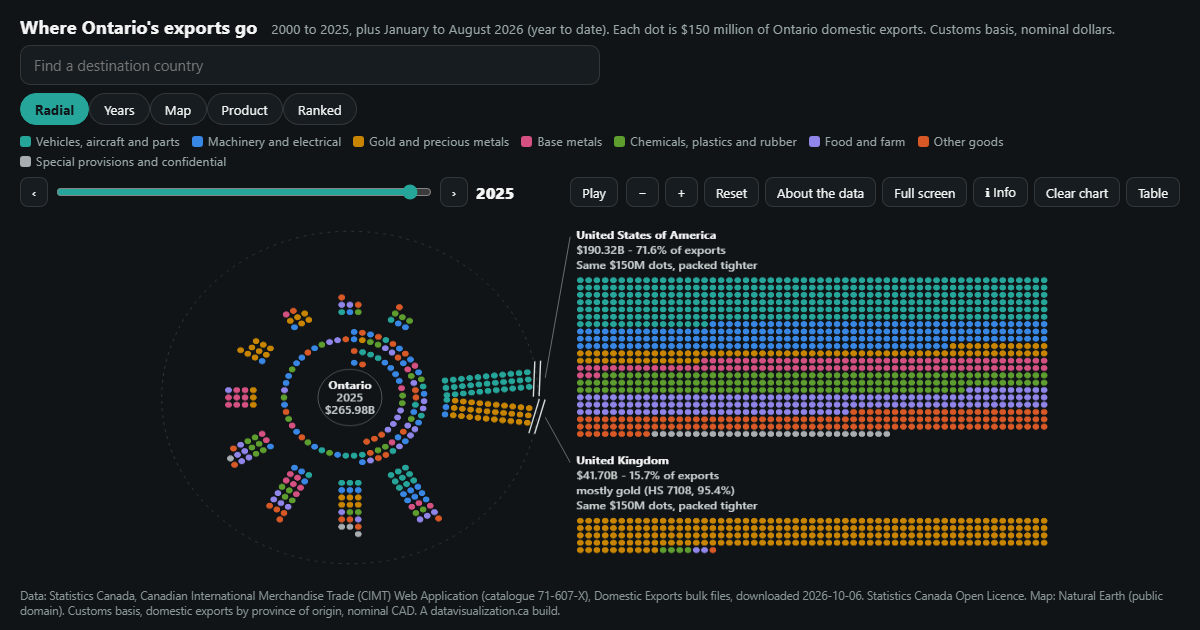
Ontario's 2025 exports as dots: 11 destinations as spokes around a ring, with the United States and the United Kingdom breaking out as large blocks.

ECONOMY - TRADE

Ontario Exports

Ontario's domestic exports to 216 destinations since 2000. The US share fell from 93.2% to 71.6% as gold surged.

See the example

Toronto Grid Pulse: every streetlight pole in Toronto as a glowing dot on the City's mapping, brightest downtown, with major roads labelled.

ECONOMY - LABOUR SHED

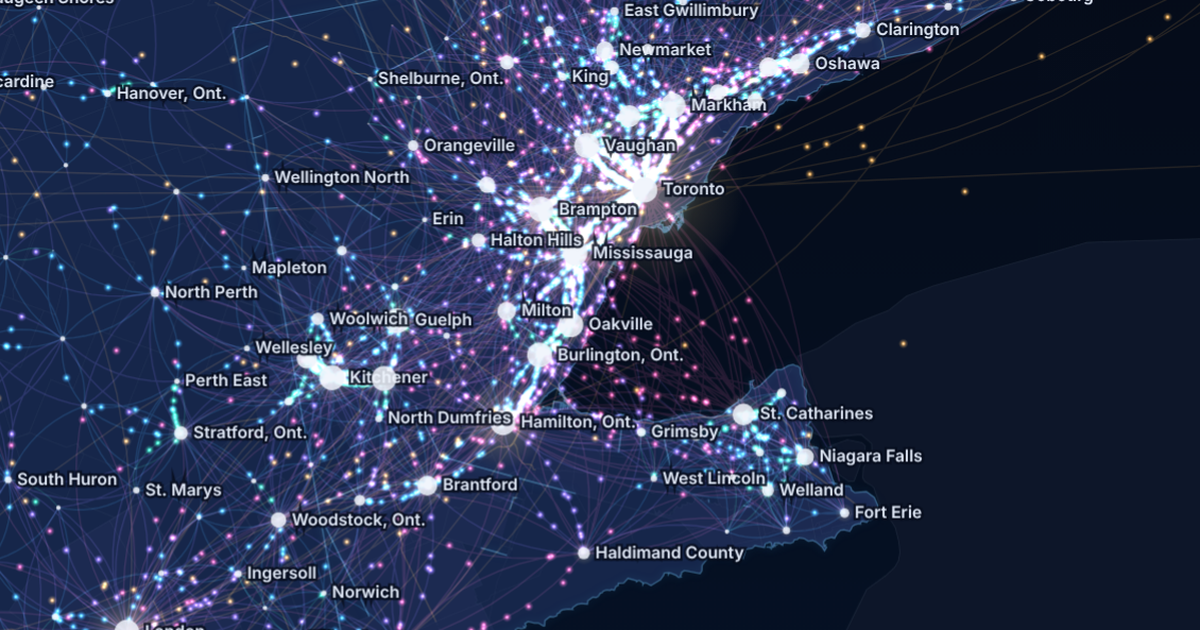
Canada Commutes

Every town-to-town commute in the 2021 Census on one animated map: 4,287,965 people crossing a town line to work.

See the example

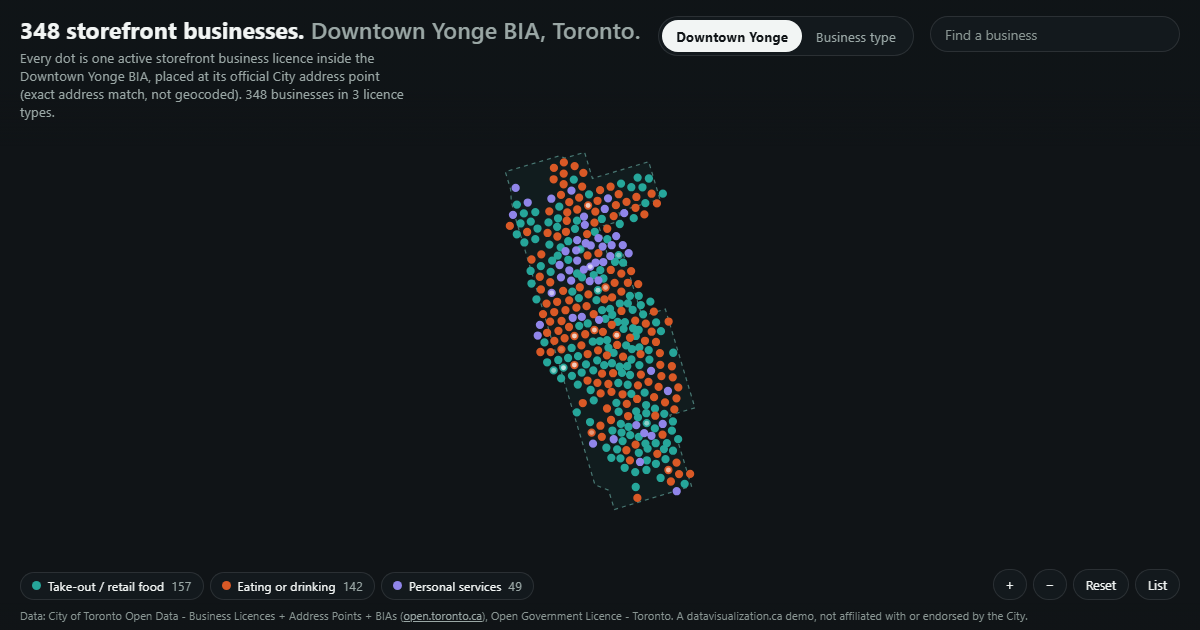
Storefront businesses in the Downtown Yonge BIA as dots inside its boundary.

ECONOMY - BUSINESS

Downtown Yonge BIA

348 storefront businesses in the BIA, each at its official City address, by licence type.

See the example

ECONOMY - DEVELOPMENT

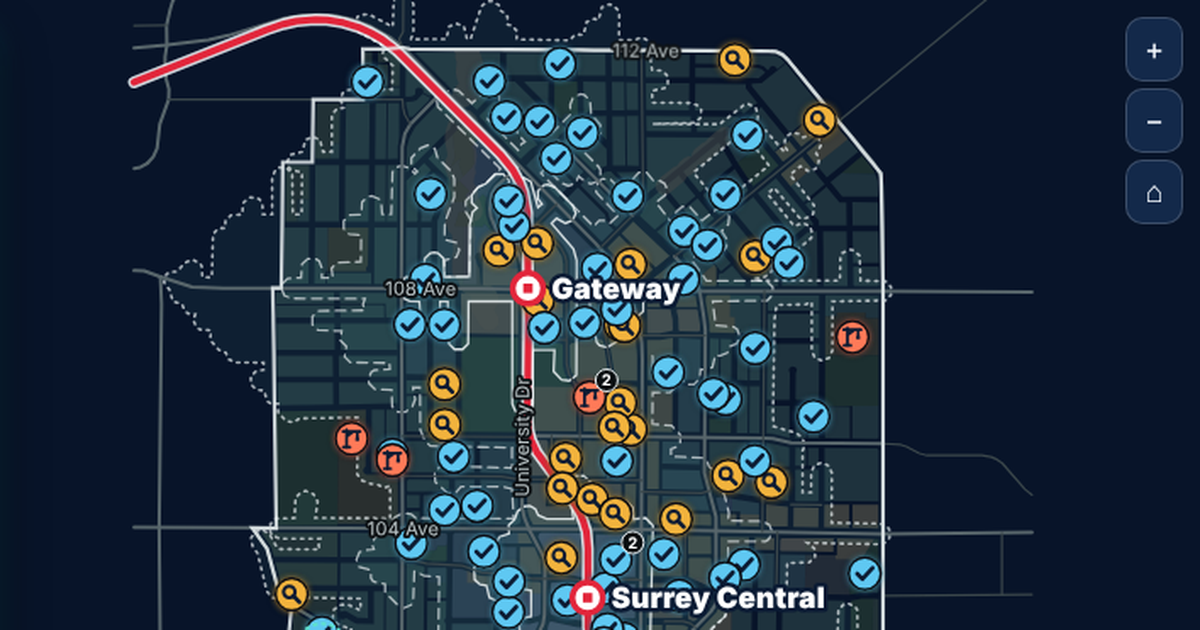
Surrey City Centre

950 development applications on their parcels, with real walking times to three SkyTrain stations.

See the example

YOUR DATA

Start from data that is already public

Most of what investors ask for is already published by Statistics Canada, your municipality and your own business surveys. If it fits in a spreadsheet, it can be visualized.

  • Labour force and wages
  • Census commuting flows
  • Trade and export data
  • Business counts by sector
  • Available land and buildings
  • Development applications
  • Building permits
  • Population growth
  • Post-secondary graduates
  • Transportation and utilities

AODA / WCAG 2.1 AA

Ready for AODA on day one

Ontario's AODA requires public sector organizations to make their websites meet WCAG 2.0 Level AA, and most economic development offices are part of a municipality or region. Every visualization we build meets WCAG 2.1 AA, a newer and stricter standard, so it can go straight onto your site.

Text table behind every chart

Every number can be read without the picture

Full keyboard access

Every control works without a mouse

Screen reader announcements

Changes are read out as people explore

Reduced motion respected

Animation can be paused or turned off

WCAG 2.1 AA on every build

WAYS TO WORK WITH US

Build it, licence it, or both

Every project is quoted after a discovery call. These are the three ways economic development teams usually work with us.

Custom build

We design and build a visualization around your region, your data and the investors you want to reach.

Licence

Use one of our ready-made visualizations with your own data and branding, on a monthly or yearly plan.

Build and licence

A custom build to start, then a licence that keeps it hosted and refreshed as new Census and trade data is released.

HOW IT WORKS

From first call to investor-ready

1

Discovery call

Tell us who you want to attract and what data you have. We suggest what the experience could look like.

2

Scope and quote

We review the data, confirm what it can honestly show, and send you a quote.

3

Build and review

You see a working draft early, and we refine it with your team.

4

Launch and update

It goes live on your website and is refreshed as new data comes out.

Questions economic development teams ask us

Yes. Census, labour force and trade data from Statistics Canada are published under the Statistics Canada Open Licence, and we credit the source on every page.
Yes. Side-by-side charts and shaded maps compare your region with neighbours or competitors on the same measures, using the same sources.
Yes. We set each build up so new releases can be added and the visualization refreshed, whether you update it yourself or have us do it.
Yes. Each visualization is a single web page that embeds on any website that allows an embed, and it meets WCAG 2.1 AA.
Every project is quoted. The price depends on the size and condition of your data, the number of views, and features like maps, tours or downloadable reports. See what affects pricing, or book a discovery call for a quote.

Put your region on the short list

Tell us who you want to attract and what data you have. We will show you what an interactive profile could look like and what it takes to build it.