Home Industries Financial Services & Insurance

INDUSTRIES

Data Visualization for Financial Services and Insurance

We turn performance, holdings and risk data into clear interactive charts and branded reports that clients, advisors and regulators can explore on their own.

THE CHALLENGE

Numbers clients can finally follow

Financial firms produce a steady stream of data: performance, holdings, allocations, claims and risk measures. It reaches clients as dense tables and monthly PDFs, and the story behind the numbers gets lost.

An interactive visualization shows clients what they own, how it has moved and why, with exact figures behind every chart and nothing estimated.

TODAY

  • Fund facts and commentary as static PDFs
  • Reports rebuilt by hand every month or quarter
  • Clients unsure what they own or why it moved

WITH AN INTERACTIVE VISUALIZATION

  • Interactive views of holdings and performance
  • Branded reports produced in seconds
  • Clear for every client, WCAG 2.1 AA

Questions clients and advisors ask

WHAT WE BUILD

What we build for financial services

Fund and portfolio explorers

Holdings, allocations and performance in one interactive view, with exact figures and a text table behind every chart.

Instant branded reports

Advisors and clients generate a branded PDF or PowerPoint of the exact view in seconds.

Flow and allocation charts

Where money comes from and where it goes, shown as flows people can follow.

Performance over time

Returns, benchmarks and distributions animated over time, with every period labelled.

Risk and claims maps

Claims, exposure or coverage shaded by region, for underwriting and reporting teams.

Commentary to report tools

Paste monthly commentary and data, and get a formatted, on-brand report back.

LIVE EXAMPLES

See it working

Live examples built from real public financial data, checked line by line. Our client fund work is shared privately on a discovery call. Every number below comes from the published source.
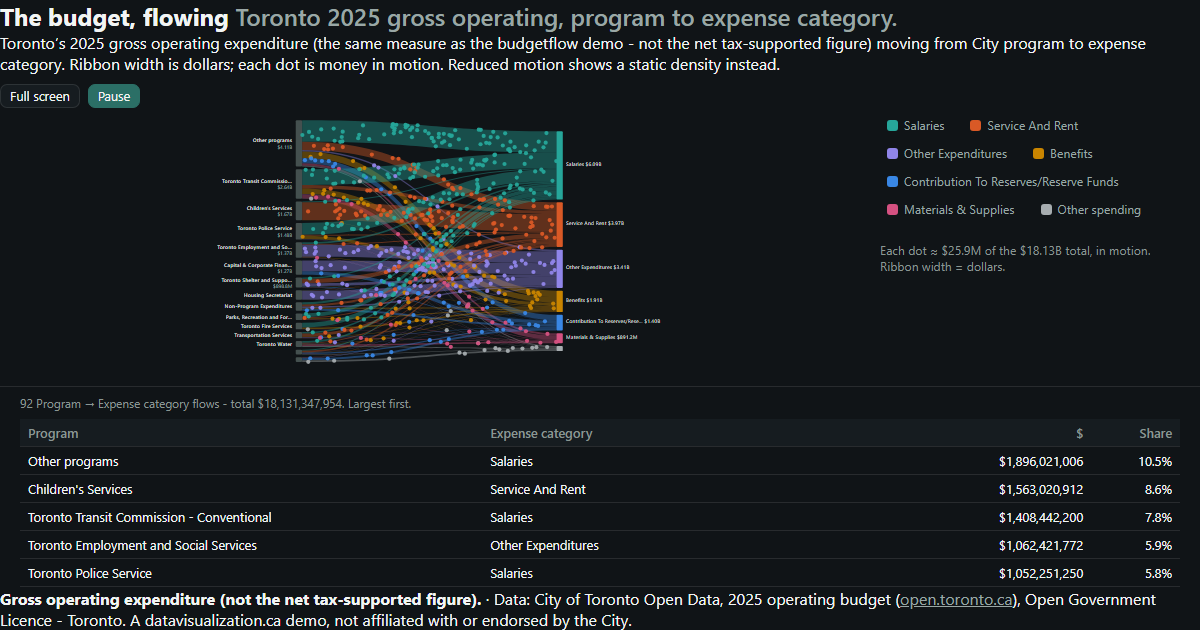
Toronto's 2025 operating budget flowing from programs to expense categories.

FINANCE - SPENDING FLOWS

Toronto Budget

$18.13 billion of 2025 operating spending, flowing from City programs to what the money buys.

See the example

Toronto Grid Pulse: every streetlight pole in Toronto as a glowing dot on the City's mapping, brightest downtown, with major roads labelled.

FINANCE - TRADE VALUE

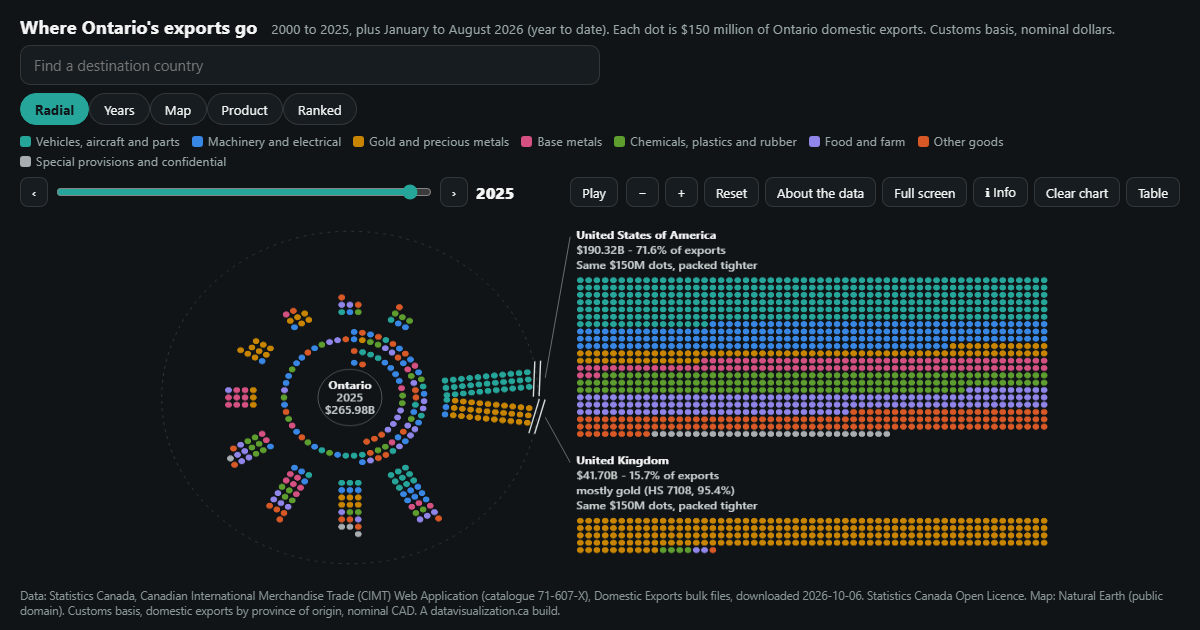
Ontario Exports

Ontario's domestic exports to 216 destinations since 2000. The US share fell from 93.2% to 71.6% as gold surged.

See the example

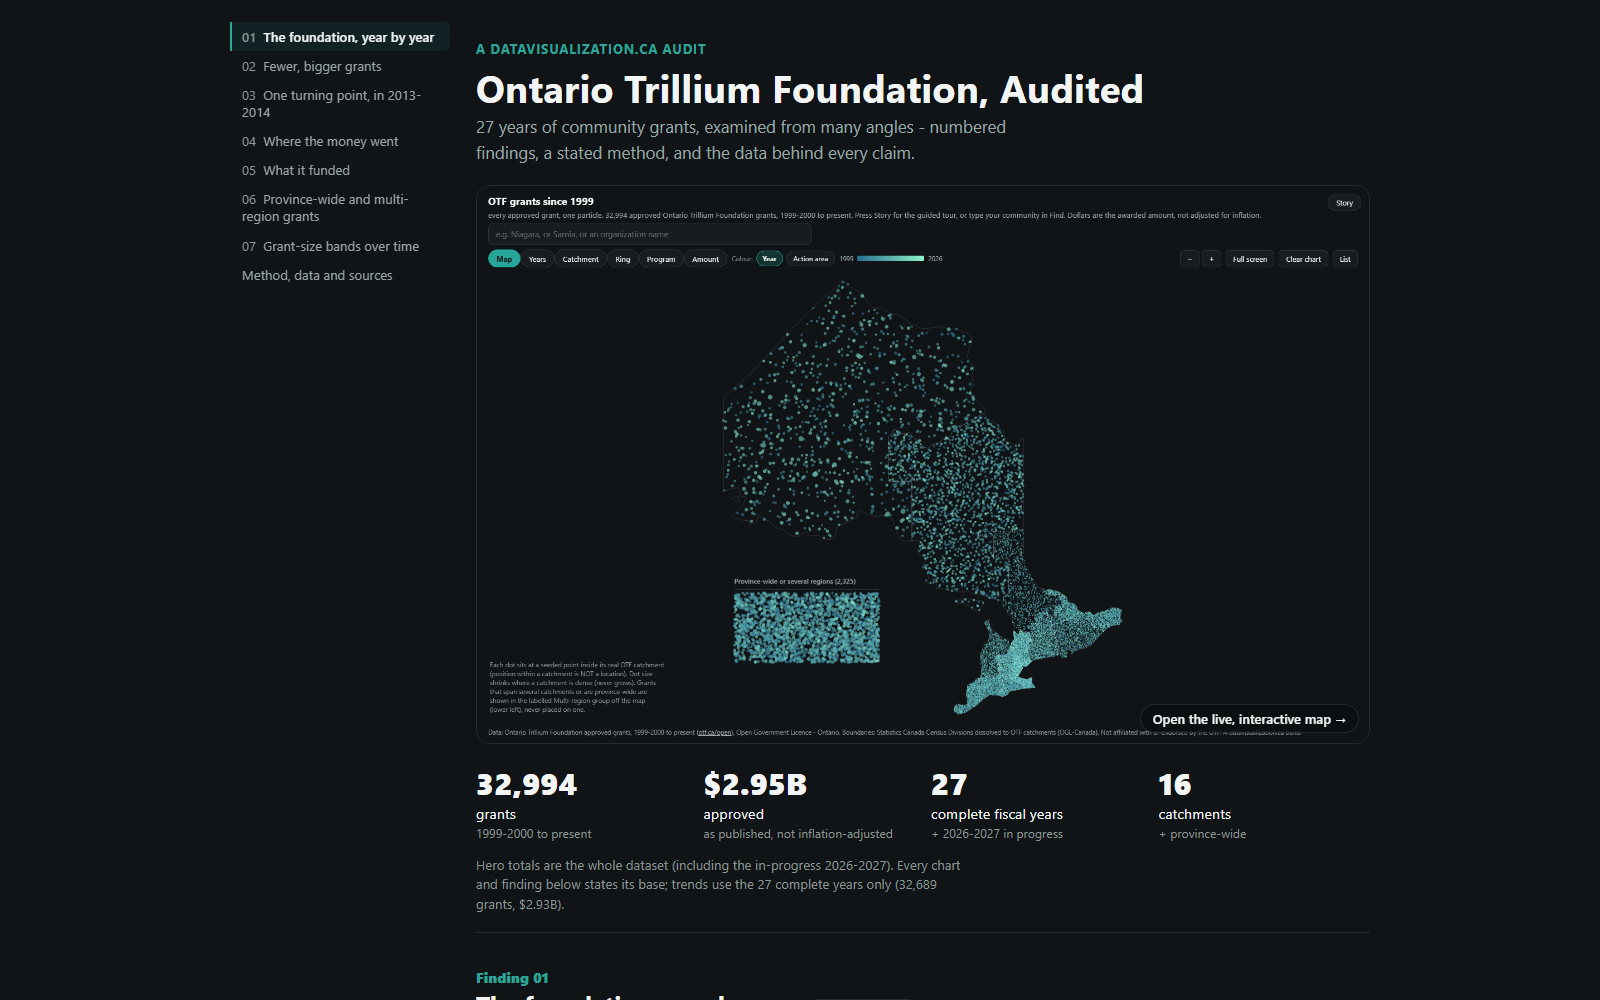
The audit page: the title Ontario Trillium Foundation, Audited, a map of Ontario made of one dot per grant, and four headline numbers: 32,994 grants, $2.95B approved, 27 complete fiscal years, 16 catchments.

FINANCE - AUDITED DATA

Ontario Trillium Foundation, Audited

27 years of grants examined from every angle: seven numbered findings, a stated method and an inflation-adjusted view.

See the example

Map of Ontario made of dots, one for every Ontario Trillium Foundation grant since 1999, coloured by year. Southern Ontario is densest; 2,325 province-wide grants sit in a labelled group beside the map.

FINANCE - DISBURSEMENTS

Ontario Community Grants

Every Ontario Trillium Foundation grant since 1999: 32,994 grants and $2.95 billion, one dot each.

See the example

YOUR DATA

Built from data you already produce

Your monthly and quarterly data is already in spreadsheets or exports. If it fits in a spreadsheet, it can be visualized, and every figure is checked against the source.

  • Fund performance
  • Holdings and allocations
  • Benchmark returns
  • Distributions
  • Monthly commentary
  • Claims summaries
  • Coverage and exposure by region
  • Client segments
  • Fees and expenses
  • Regulatory filings

AODA / WCAG 2.1 AA

Accessible to every client, AODA included

Ontario's AODA requires private organizations with 50 or more employees to make their public websites meet WCAG 2.0 Level AA. Every visualization and report we build meets WCAG 2.1 AA, a newer and stricter standard, including tagged, accessible PDFs.

Text table behind every chart

Every number can be read without the picture

Full keyboard access

Every control works without a mouse

Screen reader announcements

Changes are read out as people explore

Reduced motion respected

Animation can be paused or turned off

WCAG 2.1 AA on every build

WAYS TO WORK WITH US

Build, licence, or both

Every project is quoted after a discovery call. Here is how financial firms usually work with us.

Custom build

We design and build a visualization around your funds or products, your data and your clients, ready to embed on your site.

Licence

Use one of our ready-made tools, like branded reports, with your own data and branding, on a monthly or yearly plan.

Build and licence

A custom build to start, then a licence that keeps it hosted, supported and refreshed every reporting period.

HOW IT WORKS

From first call to first report

1

Discovery call

Tell us what clients need to understand and what data you produce. We suggest what the experience could look like.

2

Scope and quote

We review the data, agree how every figure is checked, and send you a quote.

3

Build and review

You see a working draft early, and we refine it with your team and compliance.

4

Launch and update

It goes live, and it is refreshed each month or quarter as new data arrives.

Questions financial firms ask us

Every figure is calculated from your source data and checked against it, and charts show exact values, not rounded estimates. Nothing is estimated or filled in.
Yes. We build in a review step, and nothing is published until your team signs off.
Yes. Our report tools turn your data and commentary into branded PDF and PowerPoint files in seconds, with accessible, tagged PDFs.
No. It presents your data clearly and accurately. Any interpretation or advice stays with you and your advisors.
Every project is quoted. The price depends on the size and condition of your data, the number of views, and features like maps, tours or downloadable reports. See what affects pricing, or book a discovery call for a quote.

Give clients numbers they can understand

Tell us about your products and the data you report. We will show you what an interactive experience could look like and what it takes to build it.