Home Industries Tourism Organizations & DMOs

INDUSTRIES

Data Visualization for Tourism Organizations and DMOs

We turn your listings, visitor numbers and seasonal data into interactive maps and stories that travellers, members and funders can explore on their own.

THE CHALLENGE

Your destination has a story the spreadsheet cannot tell

Tourism organizations collect a lot: member listings, visitor counts, occupancy, event calendars and survey results. Most of it ends up in a PDF guide, a members-only report or a spreadsheet only one person understands. Travellers see a list of links, and your board sees a table.

An interactive map or data story shows what makes your region worth the trip, and lets each visitor find the part that matters to them.

TODAY

  • Visitor guides that are out of date the day they print
  • Visitor and occupancy figures locked in spreadsheets
  • Board reports that take days to pull together

WITH AN INTERACTIVE VISUALIZATION

  • A living map of everything to see, stay and eat
  • Travellers plan their own trip in a few clicks
  • Open to every visitor, WCAG 2.1 AA

Questions travellers and partners ask

WHAT WE BUILD

What we build for tourism organizations

Destination maps

Every place to stay, eat, explore and shop on a real map, filtered by category, town or season.

Seasonal visitor trends

Visitor and occupancy figures animated month by month, so peaks and quiet seasons are easy to see.

Itinerary and trail explorers

Routes, trails and day trips drawn on the map, with distances and stops people can follow.

Member and partner directories

Your member listings as a searchable, living map, kept current from the list you already maintain.

Regional comparisons

Shaded maps and side-by-side charts that compare towns and sub-regions on visits, spending and stays.

Branded partner reports

Give members and funders a branded PDF or PowerPoint of the exact view they are looking at.

LIVE EXAMPLES

See it in action

Live examples built from real places and real open data. Every number on these pages comes from the published source.
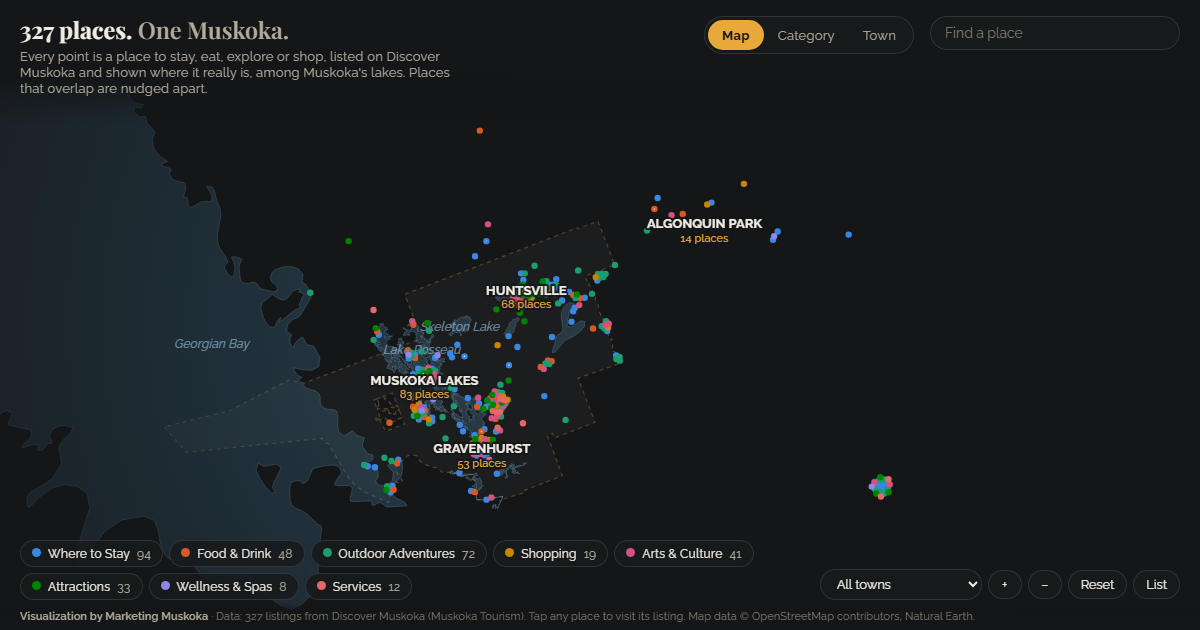
Muskoka's tourism listings as dots among the region's real lakes.

TOURISM - DESTINATION

Muskoka Tourism

327 tourism listings among Muskoka's real lakes, explored by category and by town.

See the example

Toronto Grid Pulse: every streetlight pole in Toronto as a glowing dot on the City's mapping, brightest downtown, with major roads labelled.

TOURISM - ATTRACTION

Above the Falls

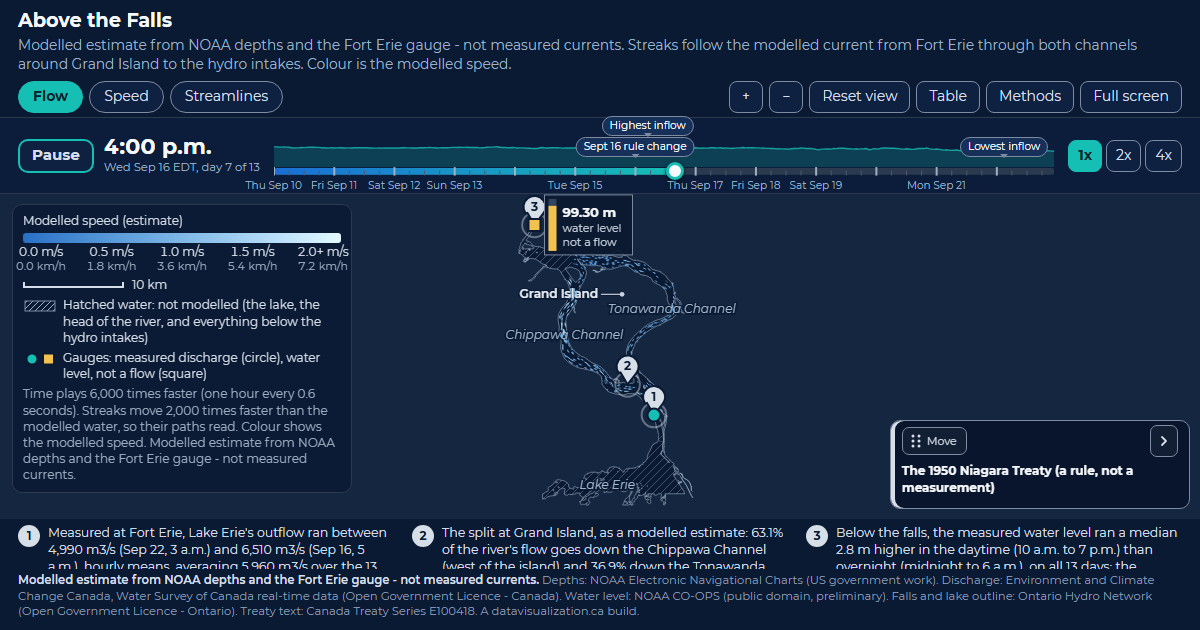
Lake Erie's water around Grand Island to the hydro intakes. Modelled, 63.1% takes the Chippawa Channel; the published figure is about 60%.

See the example

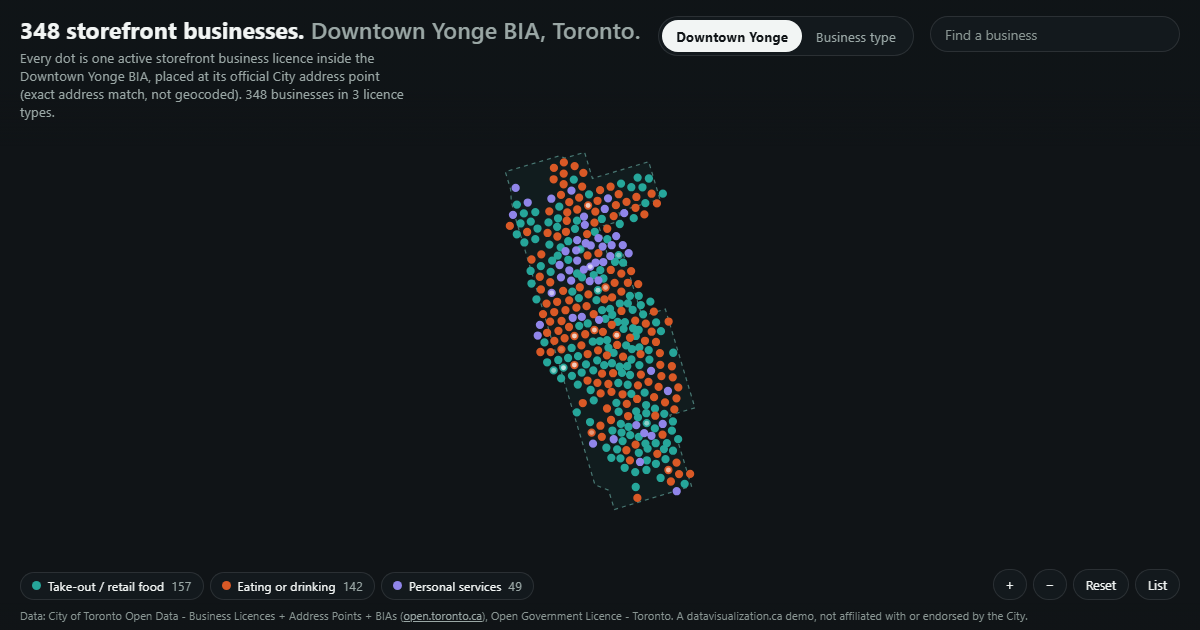
Storefront businesses in the Downtown Yonge BIA as dots inside its boundary.

DOWNTOWN - BUSINESS

Downtown Yonge BIA

348 storefront businesses in the BIA, each at its official City address, by licence type.

See the example

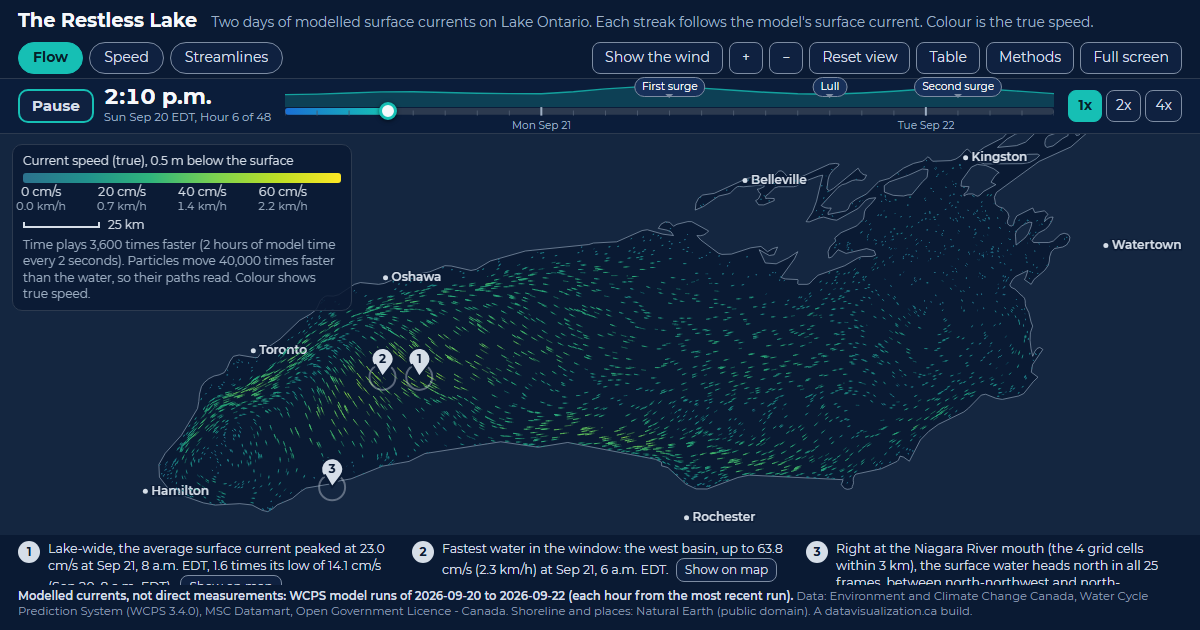
The Restless Lake: Lake Ontario filled with glowing streaks that follow the modelled surface current, coloured by speed.

TOURISM - WATERFRONT

The Restless Lake

Two days of modelled surface currents on Lake Ontario. Every streak follows the current; the west basin peaks at 63.8 cm/s.

See the example

YOUR DATA

Start with the data you already collect

If it lives in a spreadsheet or a listings database, it can be visualized. Most tourism organizations already have more than enough to start. No clean dataset? We can build one from public sources.

  • Member and business listings
  • Visitor counts by month
  • Hotel occupancy and room nights
  • Event calendars
  • Visitor survey results
  • Trail and route files
  • Attraction attendance
  • Website and booking trends
  • Regional tourism statistics
  • Parks and conservation areas

AODA / WCAG 2.1 AA

Welcoming to every visitor, AODA included

Ontario's AODA requires public sector organizations, and private and nonprofit organizations with 50 or more employees, to make their websites meet WCAG 2.0 Level AA. Every visualization we build meets WCAG 2.1 AA, a newer and stricter standard, so it can go on your destination site without an accessibility retrofit.

Text table behind every chart

Every number can be read without the picture

Full keyboard access

Every control works without a mouse

Screen reader announcements

Changes are read out as people explore

Reduced motion respected

Animation can be paused or turned off

WCAG 2.1 AA on every build

WAYS TO WORK WITH US

Build it, licence it, or do both

Every project starts with a discovery call and a quote. These are the three ways tourism teams usually work with us.

Custom build

We design and build a visualization around your destination, your data and your visitors, ready to embed on your site.

Licence

Use one of our ready-made visualizations with your own listings and branding, on a monthly or yearly plan.

Build and licence

A custom build to launch, then a licence that keeps it hosted, supported and refreshed each season.

HOW IT WORKS

From first conversation to launch

1

Discovery call

Tell us who you want to reach and what data you have. We sketch what the experience could look like.

2

Scope and quote

We review your data, confirm what it can honestly show, and send you a quote.

3

Build and review

You see a working draft early, and we refine it with your team.

4

Launch and update

It goes live on your website and can be refreshed as listings and seasons change.

Questions tourism teams ask us

Yes. Each visualization is a single web page that embeds on any website that allows an embed, including WordPress. It can also live on its own page and be shared with one link in campaigns and newsletters.
Yes. We connect the visualization to the list you already maintain, so new members and closed businesses show up when the list is updated.
Yes. Every build works on phones and tablets, with touch-friendly controls, and meets WCAG 2.1 AA.
No. Most projects start from a spreadsheet export or a listings database. We clean, check and document it, and we never fill gaps with made-up numbers.
Every project is quoted. The price depends on the size and condition of your data, the number of views, and features like maps, tours or downloadable reports. See what affects pricing, or book a discovery call for a quote.

Give visitors a reason to explore further

Tell us about your destination and the data you keep. We will show you what an interactive experience could look like and what it takes to build it.