Home Examples Wind Over the Lakes

LIVE EXAMPLE - OPEN DATA

Wind Over the Lakes

Two days of wind 10 m above the ground across Southern Ontario and the lower Great Lakes, September 20 to 22, 2026, from Environment and Climate Change Canada's High Resolution Deterministic Prediction System. The same 48 hours as The Restless Lake, so you can see what pushed the water. Modelled wind, not direct measurements.

Modelled 10 m wind every 2 hours from September 20, 8 a.m. to September 22, 8 a.m. EDT. Data Source: Environment and Climate Change Canada, High Resolution Deterministic Prediction System (HRDPS, 2.5 km), MSC Datamart, Open Government Licence - Canada. Lakes, borders and places: Natural Earth (public domain).

49 km/h

strongest wind in the window, over Lake Erie, Sep 22, 6 a.m. EDT

36 km/h

average across Lake Ontario at its peak, Sep 21, 2 a.m. EDT

2.8x

as strong over the lakes as over land, averaged over two days

48 hours

the same window as The Restless Lake

What the data reveals

LAKE ONTARIO

The night the lake got its push

Over Lake Ontario the wind was strongest at Sep 21, 2 a.m. EDT: 36 km/h on average across the lake, from the north-northeast.

LAKE ERIE

The strongest wind came at dawn

Strongest wind in the window: 49 km/h from the east-northeast at Sep 22, 6 a.m. EDT, over Lake Erie.

WATER AGAINST LAND

Wind runs faster over open water

Averaged over the two days, the wind over the lakes was 2.8 times as strong as over land (30 against 10 km/h): open water slows the air less than land does.

READ IT WITH THE LAKE

One weather system, two pieces

This is the wind behind The Restless Lake. Open the currents piece and turn on "Show the wind" to see both at once.

INTERACTIVE

How to explore it

Three ways to see the wind

Flow animates the streaks, Speed shades the map by wind speed, and Streamlines draws the paths as still lines.

Scrub through two days

Drag the timeline or press Play. Markers jump to the Lake Ontario peak and the strongest wind.

Direction in plain words

Wind is named by where it blows from; the readout gives both the from and toward directions.

Read any spot

Hover or tap anywhere for speed in km/h and m/s and the direction. Drag the cards out of the way.

Zoom and pan

Ctrl and scroll, pinch, or the + and - buttons. Reset view puts everything back.

Keyboard and table

Arrow keys move a probe across the map with each reading announced. The Table gives each lake and the land for every frame.

About the data

Every figure on this page is computed from the data in the visualization, and the visualization says plainly what is measured and what is modelled.

  • Source: Environment and Climate Change Canada, High Resolution Deterministic Prediction System (HRDPS), continental 2.5 km configuration, MSC Datamart. 10 m wind U and V. Open Government Licence - Canada (Data Source: Environment and Climate Change Canada).
  • Model output (a short-range forecast), not measurements. Each 2-hour frame comes from the most recent model run at forecast hours 1 to 6.
  • HRDPS runs on a rotated grid; the wind was rotated to true east and north and checked against ECCC's published wind direction (median difference 0.11 degrees). Each 0.1 degree cell is the mean of the 12 to 16 HRDPS points inside it.
  • Highest cell-mean wind in the window: 13.5 m/s (49 km/h). Cell means smooth out the strongest 2.5 km values; gusts are not shown.
  • Motion is sped up so it can be seen: time plays 3,600 times faster and particles move 2,000 times faster than the wind. Colour is always the true speed.
  • Lakes, borders and places: Natural Earth (public domain). Not affiliated with or endorsed by Environment and Climate Change Canada.
Have data that moves?

Weather, water, traffic or shipments: we turn flows into maps anyone can explore, with every number traceable to its source. Tell us about your data.

More flows

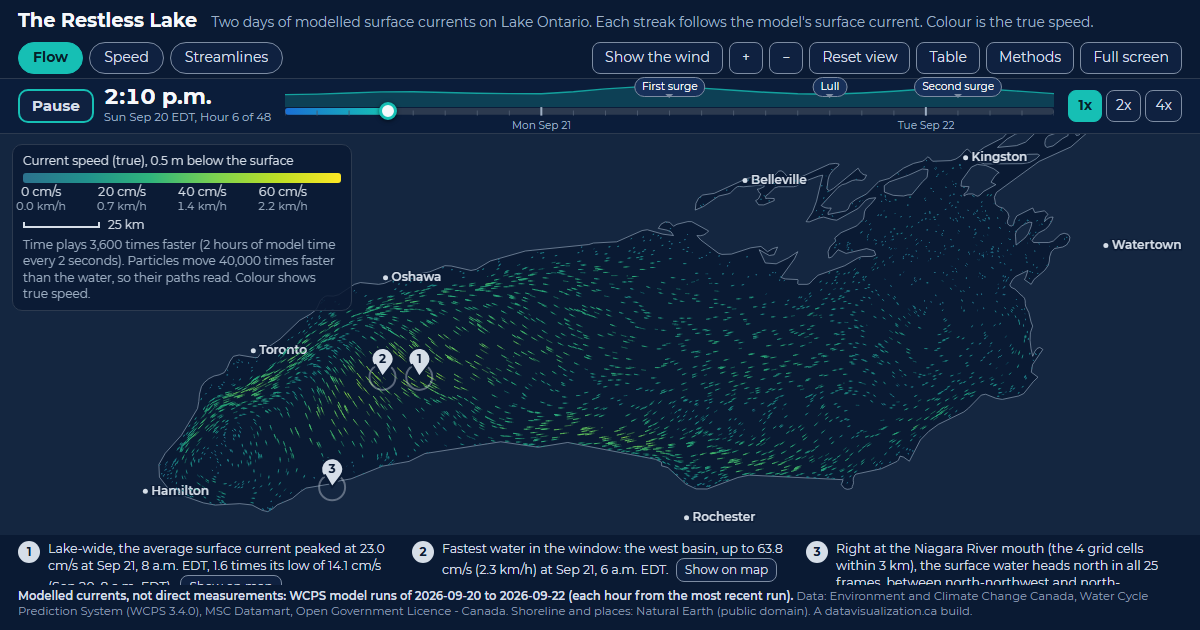
The Restless Lake: Lake Ontario filled with glowing streaks that follow the modelled surface current, coloured by speed.

The Restless Lake

Lake Ontario currents. 23.0 cm/s lake-wide average current at its peak, Sep 21, 8 a.m. EDT.

See the example

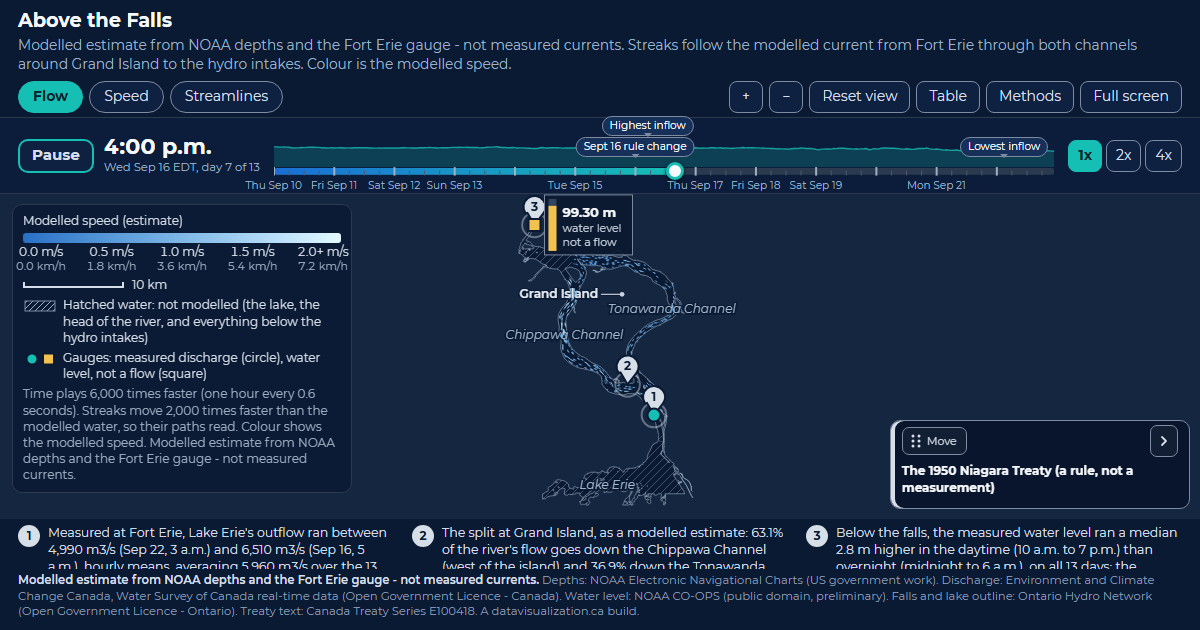
Above the Falls: the upper Niagara River with pale blue streaks splitting around Grand Island into the Chippawa and Tonawanda channels.

Above the Falls

Upper Niagara River. 5,960 m3/s Lake Erie's average measured outflow at Fort Erie over the 13 days.

See the example

Downtown Pulse: downtown Toronto streets with glowing counted road segments and small dots travelling along them, coloured by measured speed.

Downtown Pulse

Downtown Toronto traffic. 44,591 vehicles an hour across all counted directions at the 5:30 p.m. peak.

See the example