Home Industries Franchise & Multi-location Businesses

INDUSTRIES

Data Visualization for Franchise and Multi-location Businesses

We turn location data, sales and market information into interactive maps and dashboards your head office, franchisees and investors can explore on their own.

THE CHALLENGE

Many locations, one picture

Running many locations means data arrives from everywhere: sales, staffing, customer feedback, leases and local markets. It lands in separate spreadsheets and monthly reports, and by the time someone has compared them, the moment to act has passed.

An interactive map or dashboard puts every location side by side, so patterns, gaps and opportunities show up at a glance.

TODAY

  • A different spreadsheet from every location
  • Hard to see which locations lead and which lag
  • New sites picked on instinct instead of evidence

WITH AN INTERACTIVE VISUALIZATION

  • Every location on one interactive map
  • Compare and rank locations in a click
  • Clear for everyone, WCAG 2.1 AA

Questions owners and franchisees ask

WHAT WE BUILD

What we build for multi-location businesses

Network maps

Every location on a real map, coloured by the measure you care about, with a card for each site.

Location scorecards

Side-by-side charts that rank and compare locations on sales, service or growth.

Trade area profiles

The businesses, foot traffic and population around each location, drawn from public data.

Site selection maps

Candidate sites layered with competitors, transit, traffic and new development.

Trends over time

Weekly or monthly results animated across the network, so seasons and changes stand out.

Branded franchisee reports

Each franchisee can download a branded PDF or PowerPoint of their own location.

LIVE EXAMPLES

See it working

Live examples built from real public data, the same layers we use to profile a location or a trade area. Every number comes from the published source.
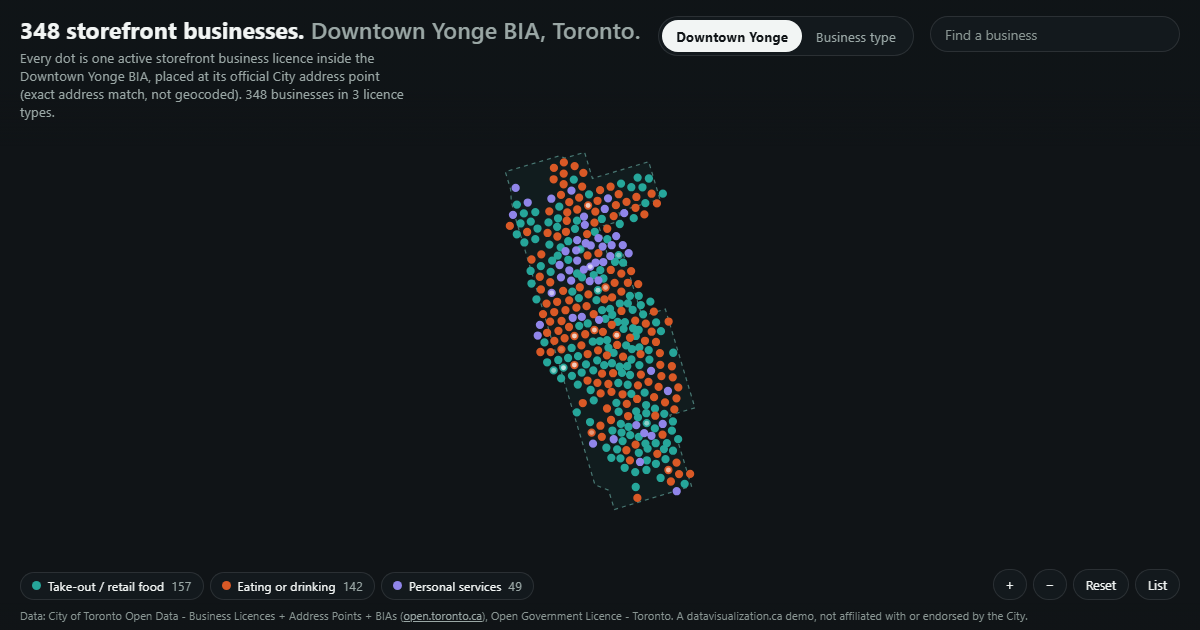
Storefront businesses in the Downtown Yonge BIA as dots inside its boundary.

TRADE AREA - BUSINESSES

Downtown Yonge BIA

348 storefront businesses in the BIA, each at its official City address, by licence type.

See the example

Toronto Grid Pulse: every streetlight pole in Toronto as a glowing dot on the City's mapping, brightest downtown, with major roads labelled.

TRADE AREA - TRAFFIC

Downtown Pulse

A typical weekday on the 145 road segments the City counted. The 5:30 p.m. peak reaches 44,591 vehicles an hour.

See the example

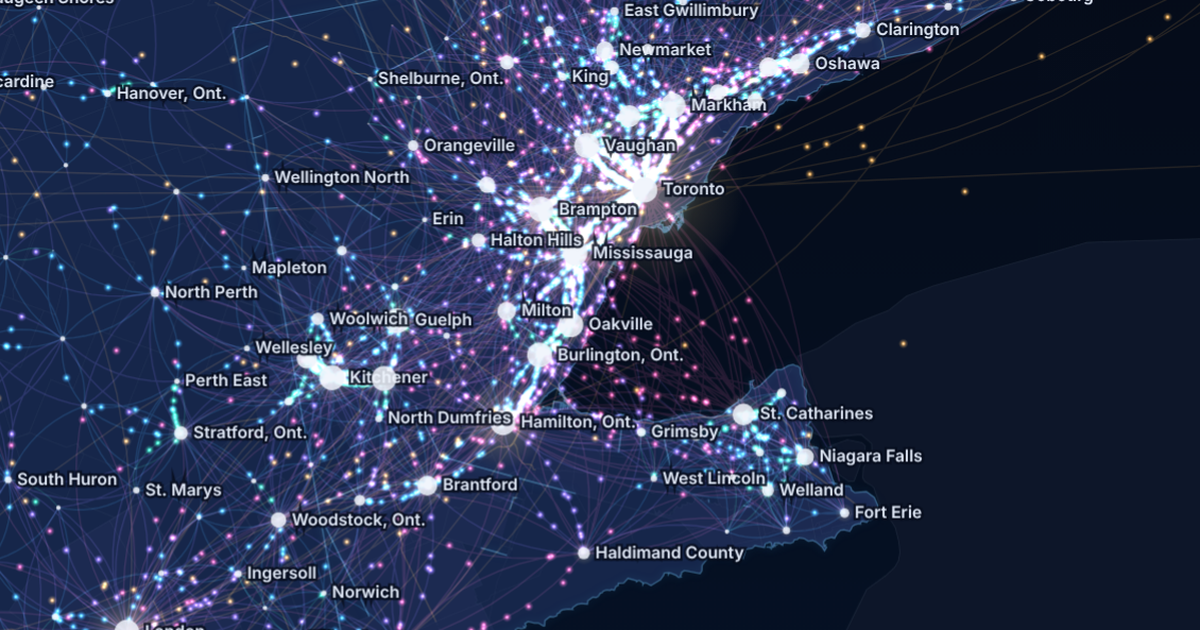
Canada Commutes: the Golden Horseshoe at night, glowing streams of commuters between Toronto, Brampton, Mississauga, Hamilton, Kitchener and Niagara.

TRADE AREA - COMMUTERS

Canada Commutes

Every town-to-town commute in the 2021 Census on one animated map: 4,287,965 people crossing a town line to work.

See the example

SITE SELECTION - DEVELOPMENT

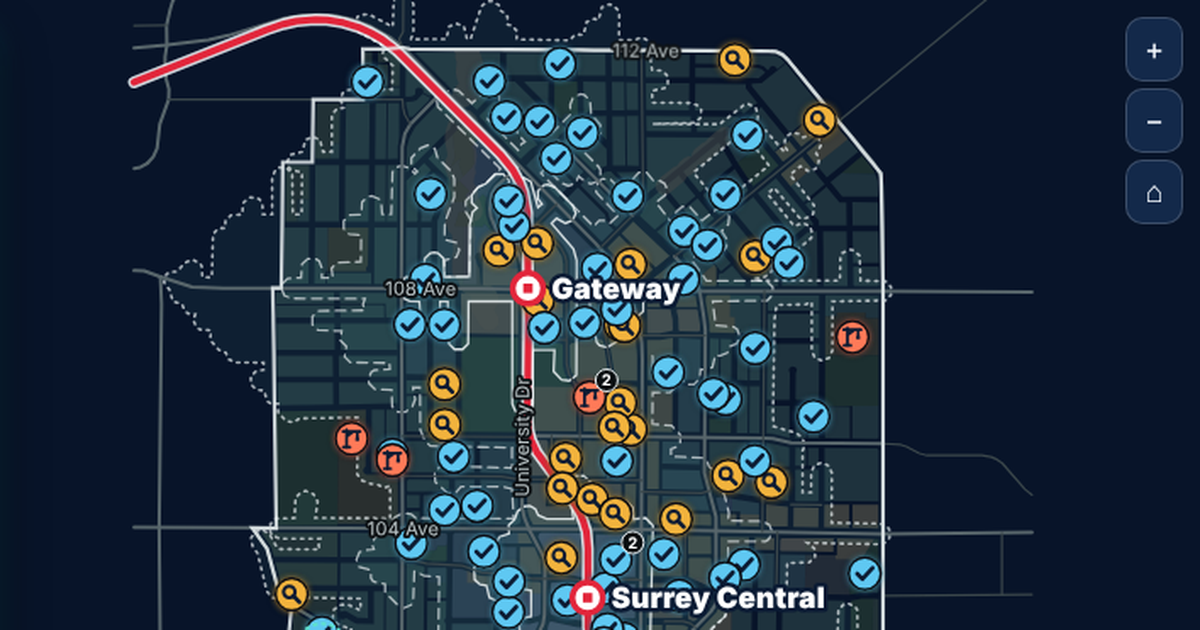
Surrey City Centre

950 development applications on their parcels, with real walking times to three SkyTrain stations.

See the example

YOUR DATA

Built from data you already have

If it fits in a spreadsheet, it can be visualized. Your point of sale, CRM and HR exports are usually enough to start, and we add public data for each trade area.

  • Location list and addresses
  • Sales by location
  • Customer counts and visits
  • Staffing and hours
  • Customer reviews and ratings
  • Lease and opening dates
  • Census population profiles
  • Business licences nearby
  • Traffic and transit data
  • Marketing and loyalty results

AODA / WCAG 2.1 AA

Accessible from the first build

Under Ontario's AODA, businesses with 50 or more employees must make their public websites meet WCAG 2.0 Level AA. Every visualization we build meets WCAG 2.1 AA, a newer and stricter standard, so it is ready for your public site or your franchisee portal.

Text table behind every chart

Every number can be read without the picture

Full keyboard access

Every control works without a mouse

Screen reader announcements

Changes are read out as people explore

Reduced motion respected

Animation can be paused or turned off

WCAG 2.1 AA on every build

WAYS TO WORK WITH US

Build, licence, or both

Every project is quoted after a discovery call. Here is how multi-location businesses usually work with us.

Custom build

We design and build a visualization around your network, your data and your audience, ready to embed on your site or portal.

Licence

Use one of our ready-made visualizations with your own locations and branding, on a monthly or yearly plan.

Build and licence

A custom build to start, then a licence that keeps it hosted, supported and refreshed as results come in.

HOW IT WORKS

From first call to rollout

1

Discovery call

Tell us who needs to see the data and what you have. We suggest what the experience could look like.

2

Scope and quote

We review the data, confirm what it can honestly show, and send you a quote.

3

Build and review

You see a working draft early, and we refine it with head office.

4

Launch and update

It goes live, and it can be refreshed weekly or monthly as new results arrive.

Questions franchise teams ask us

Yes. We can build a public view for everyone and a separate view or report for each location, depending on what you want to share.
No. We combine exports from different systems into one clean dataset, and we document every step so the numbers can be checked.
Yes. We layer your own results with public data like population, traffic, transit and new development, so candidate sites can be compared on the same map.
Yes. Each visualization is a single web page that embeds on almost any website or intranet, and it can also be shared with one link.
Every project is quoted. The price depends on the size and condition of your data, the number of views, and features like maps, tours or downloadable reports. See what affects pricing, or book a discovery call for a quote.

See your whole network at a glance

Tell us how many locations you have and what you track. We will show you what an interactive map or dashboard could look like and what it takes to build it.