Home Industries Nonprofits & Foundations

INDUSTRIES

Data Visualization for Nonprofits and Foundations

We turn grants, programs and impact data into interactive maps and stories that donors, boards and communities can explore on their own.

THE CHALLENGE

Show the good your funding does

Nonprofits and foundations track a great deal: every grant, every program, every person served and every dollar raised. Most of it is shared once a year in an annual report, and the size of the impact never quite comes through.

An interactive visualization lets donors, boards and communities see where the money goes and what it achieves, using only your real numbers.

TODAY

  • Impact reports that read like a spreadsheet
  • Grant and program data scattered across files
  • Donors asking where their money really goes

WITH AN INTERACTIVE VISUALIZATION

  • Every grant or program on one interactive map
  • Donors follow their gift to real impact
  • Open to everyone, WCAG 2.1 AA

Questions donors and communities ask

WHAT WE BUILD

What we build for nonprofits and foundations

Impact stories

Your outcomes as a guided, step-by-step story donors can follow from gift to result.

Grant and program maps

Every grant or site on a real map, searchable by community, program or year.

Where the money goes

Revenue and spending shown as flows, from donors and funders to programs and people.

Giving over time

Years of grants or donations animated, so growth and turning points are easy to see.

Community lookups

Type a town or organization and see everything it received, with totals and best years.

Branded impact reports

Board members and donors download a branded PDF or PowerPoint of the exact view.

LIVE EXAMPLES

See it working

Live examples built from real Ontario grant data, including a full audit with a stated method. Every number comes from the published source.

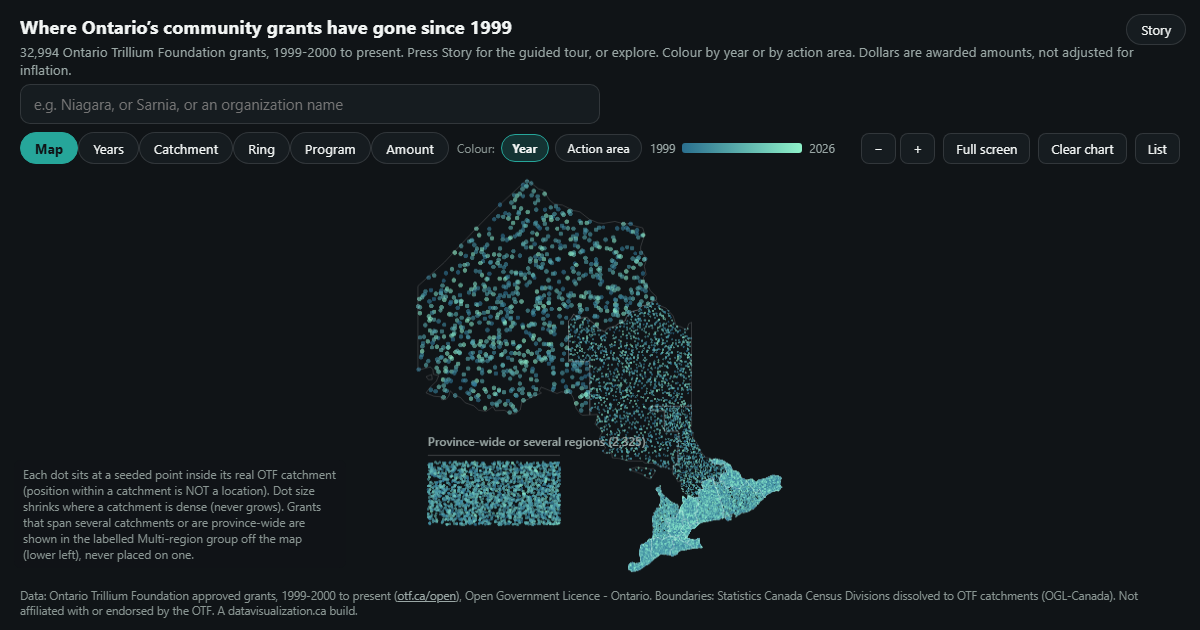
Map of Ontario made of dots, one for every Ontario Trillium Foundation grant since 1999, coloured by year. Southern Ontario is densest; 2,325 province-wide grants sit in a labelled group beside the map.

NONPROFIT - GRANTS

Ontario Community Grants

Every Ontario Trillium Foundation grant since 1999: 32,994 grants and $2.95 billion, one dot each.

See the example

Toronto Grid Pulse: every streetlight pole in Toronto as a glowing dot on the City's mapping, brightest downtown, with major roads labelled.

NONPROFIT - AUDIT

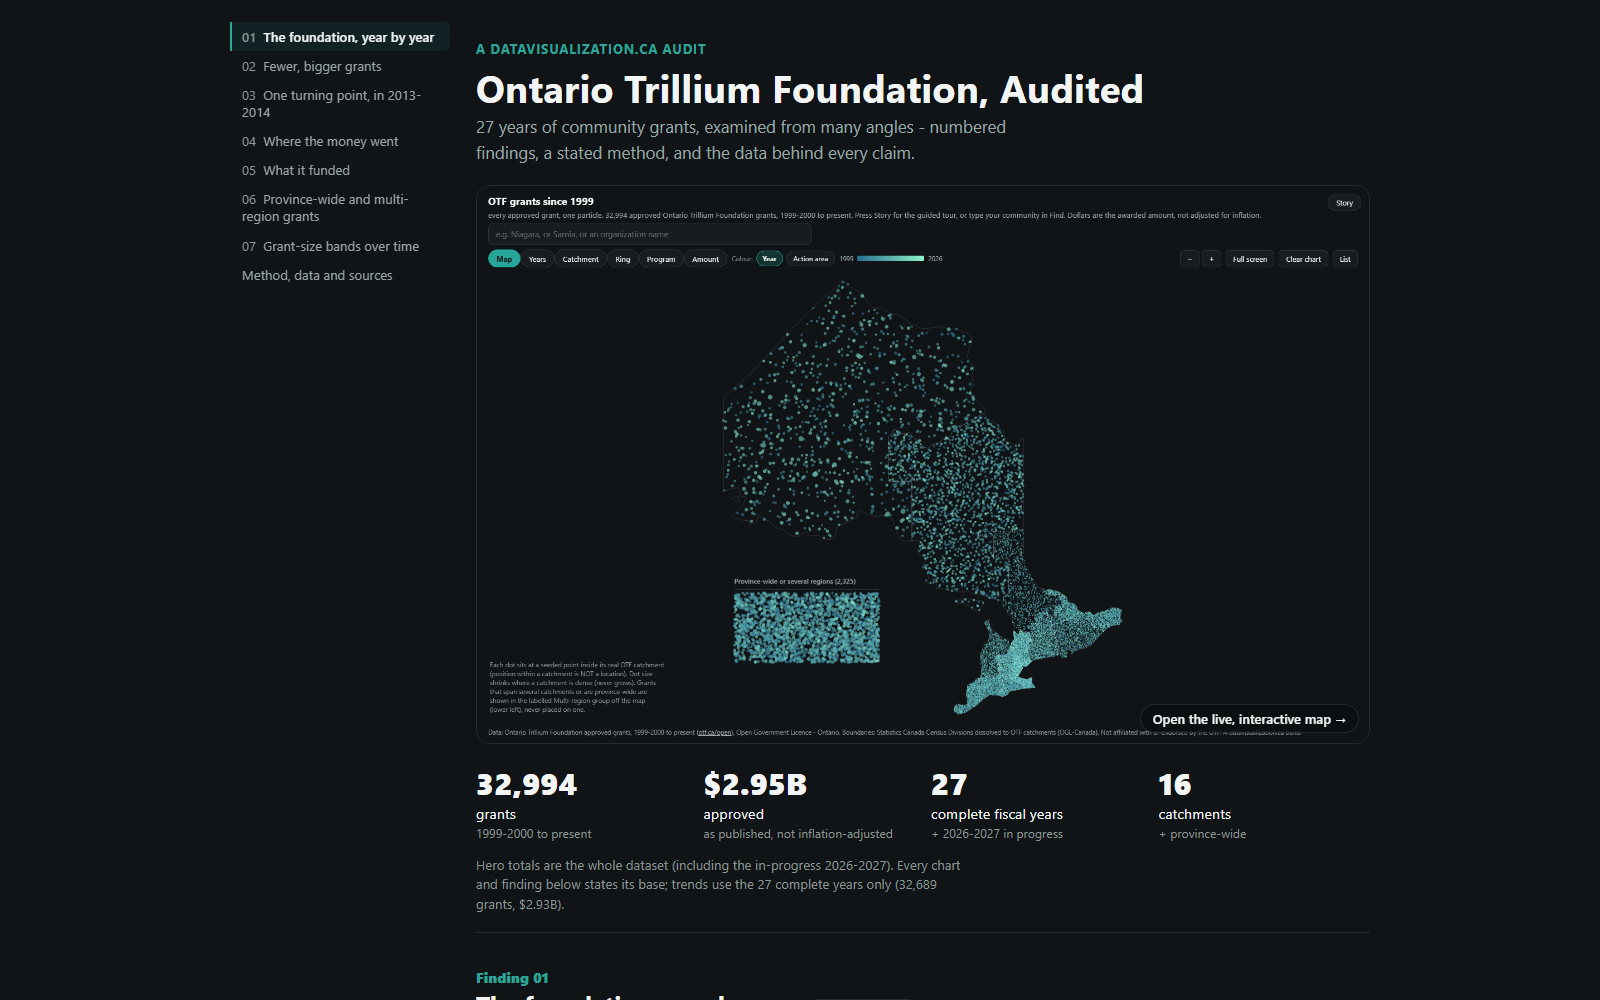
Ontario Trillium Foundation, Audited

27 years of grants examined from every angle: seven numbered findings, a stated method and an inflation-adjusted view.

See the example

A guided tour of 32,994 Ontario Trillium Foundation grants on a map of Ontario.

NONPROFIT - STORY

A Guided Tour of 32,994 Grants

Press Story and the grants regroup step by step: the largest region, the biggest program, the peak year.

See the example

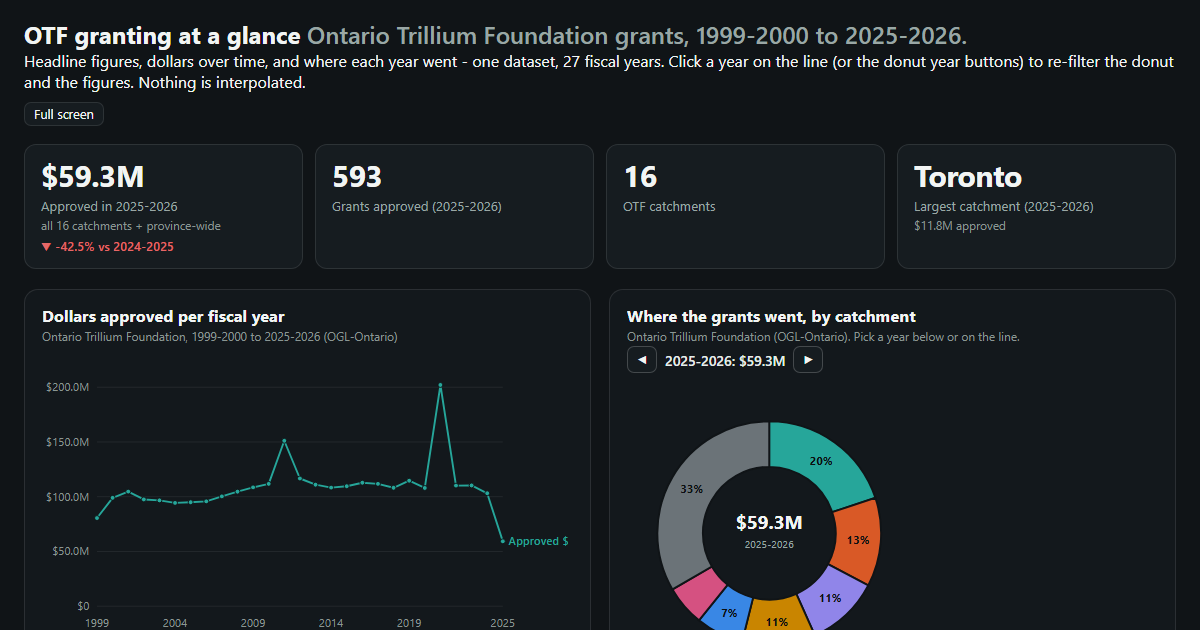
A dashboard of Ontario Trillium Foundation granting with headline figures, a line chart and a donut chart.

NONPROFIT - DASHBOARD

A Grants Dashboard

Headline figures, dollars over time and where the latest year went, from one open grants dataset.

See the example

YOUR DATA

Built from data you already keep

Your grants database, donor records and program reports are a rich start. If it fits in a spreadsheet, it can be visualized. We work only with grouped, privacy-safe data.

  • Grants and awards
  • Program sites and reach
  • People served by program
  • Donations by year
  • Volunteer hours
  • Outcome survey results
  • Revenue and spending
  • Community profiles
  • Partner organizations
  • Campaign results

AODA / WCAG 2.1 AA

Accessible to every supporter, AODA included

Ontario's AODA requires nonprofit organizations with 50 or more employees, and public sector funders, to make their websites meet WCAG 2.0 Level AA. Every visualization we build meets WCAG 2.1 AA, a newer and stricter standard, so everyone you serve can use it.

Text table behind every chart

Every number can be read without the picture

Full keyboard access

Every control works without a mouse

Screen reader announcements

Changes are read out as people explore

Reduced motion respected

Animation can be paused or turned off

WCAG 2.1 AA on every build

WAYS TO WORK WITH US

Build it, licence it, or both

Every project is quoted after a discovery call, and we can work to a grant or campaign budget. Here is how nonprofits usually work with us.

Custom build

We design and build a visualization around your mission, your data and your supporters, ready to embed on your site.

Licence

Use one of our ready-made visualizations with your own data and branding, on a monthly or yearly plan.

Build and licence

A custom build for your annual report, then a licence that keeps it hosted and refreshed every year.

HOW IT WORKS

From first call to campaign launch

1

Discovery call

Tell us who you want to reach and what data you keep. We suggest what the experience could look like.

2

Scope and quote

We review the data, protect donor and client privacy, confirm what it can honestly show, and send you a quote.

3

Build and review

You see a working draft early, and we refine it with your team.

4

Launch and update

It goes live on your website and can be refreshed each year or campaign.

Questions nonprofits ask us

We only publish grouped, privacy-safe data. Individual donors and clients are never shown, and small counts are combined so no one can be identified.
Yes. Many organizations use an interactive impact story alongside a shorter printed report, and share it all year with one link.
No. Most projects start from a database export or spreadsheet. We clean, check and document it, and we never fill gaps with made-up numbers.
Yes. Every build meets WCAG 2.1 AA, with full keyboard access and a text version of every chart.
Every project is quoted. The price depends on the size and condition of your data, the number of views, and features like maps, tours or downloadable reports. See what affects pricing, or book a discovery call for a quote.

Let supporters see the impact for themselves

Tell us about your mission and the data you keep. We will show you what an interactive experience could look like and what it takes to build it.