Home Examples Canadian Honey Bees

LIVE EXAMPLE - OPEN DATA

The Canadian Honey Bee Explorer

In an average winter Canada loses more than a quarter of its honey bee colonies - and in four of the last five winters, a third or more. Every spring beekeepers rebuild, and in most years the country ends up with more bees than it started with. We turned a century of public data into one interactive story.
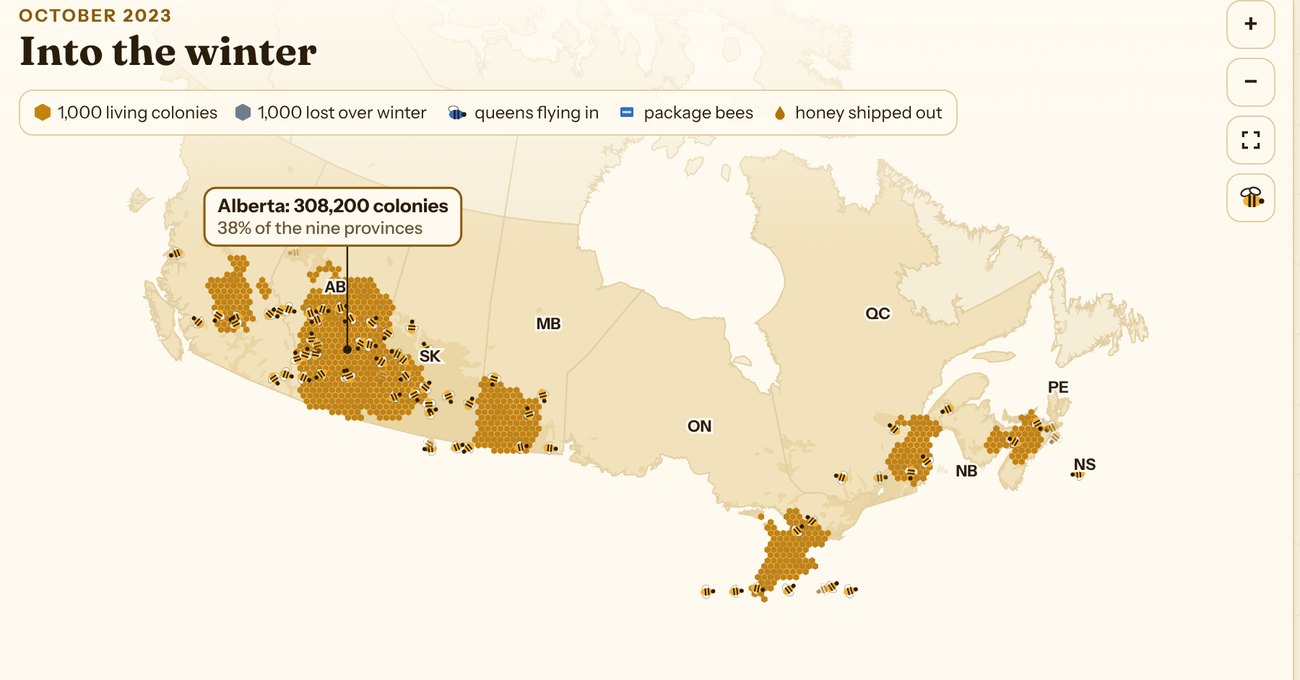
Honey bee colonies, beekeepers, honey, trade and winter losses across Canada, 1924 to 2025. Data: Statistics Canada and Agriculture and Agri-Food Canada (Open Government Licence - Canada) and the Canadian Association of Professional Apiculturists. Not endorsed by Statistics Canada, AAFC or CAPA.
854,653

honey bee colonies in Canada, 2025

34.6%

of colonies lost in the winter of 2023-24

300,000

queen bees imported in 2024

102 years

of colony and honey data, 1924 to 2025

What's inside

NARRATED STORY + ANIMATED MAP

A Year in the Hive

Fall 2023 to fall 2024, told in eleven narrated scenes. The camera flies to Alberta's giant comb, Prince Edward Island's 61% winter loss and the Prairie honey flow, while a live data board and counters keep every province's numbers.

NARRATED STORY + MAP, BUBBLES, MIGRATION

100 Years of Bees

Nine provinces, 1924 to 2025. Watch swarms grow and shrink, the beekeeper race drift from 43,000 hobbyists to fewer, bigger operations and back, and the great migration west - from 90% of colonies in the east to 63% on the Prairies.

NARRATED STORY + WORLD MAP

Bees on the Move

Queens, package bees and honey crossing Canada's border, 2020 to 2025. Queens imported by country against that spring's winter loss, and a honey seesaw that tips each year between what Canada sells and what it buys.

NARRATED STORY + LINKED CHART, MAP, GRID

Winter Losses

Every winter since 2007 for every province, from CAPA's annual statements. Click any winter or any province and everything follows - the map, the national chart, a twenty-winter grid and a province card with its whole history. Then guess last winter's loss.

INTERACTIVE

How to explore it

Play the story

Each view has its own narrated story. Press Play the story, and every narrated word is also shown on screen.

Take the How it works tour

Each view has a short tour of its own controls, so you know what every button does before you start.

Click a winter or a province

In Winter Losses, everything follows your choice: the map, the national chart, the twenty-winter grid and the province card.

Read it as text

Every view has a sortable table with every number, for anyone who would rather read than watch.

Keyboard and screen readers

Every view works by keyboard, changes are announced to screen readers, and narration can be turned off.

Still the bees

The flying bees can be stilled with one button. They start still for anyone who has reduced motion turned on.

About the data

Honey bees pollinate orchard fruit, berries, vegetables, forage crops and hybrid canola seed. In 2021, Agriculture and Agri-Food Canada estimated that honey bee pollination adds about $3.18 billion a year in extra harvest value to Canadian crops - around $7 billion once hybrid canola seed is counted. Beekeepers lose colonies every winter at rates well above the 15% CAPA suggests is acceptable, and rebuild every spring by splitting hives and importing queens. Every figure in the Explorer comes from the public sources below.

Have data that deserves this treatment?

We build interactive visualizations from public or private data, with narrated stories, tables and keyboard access, hosted for you and embedded on any site. Tell us about your data.

More examples

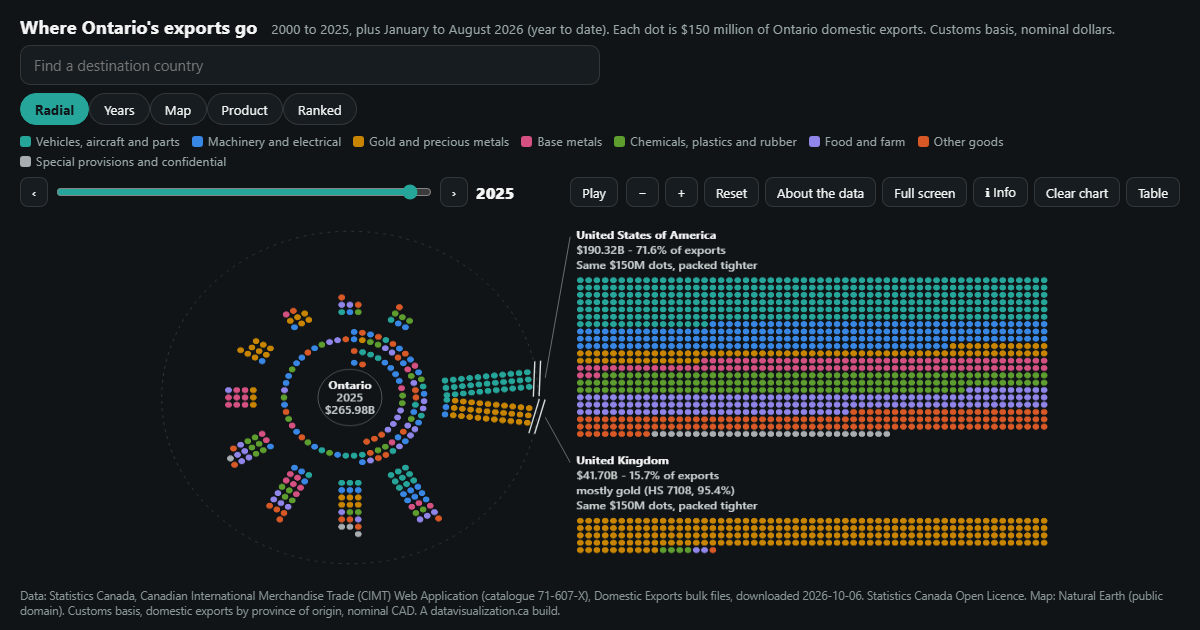
Ontario's 2025 exports as dots: 11 destinations as spokes around a ring, with the United States and the United Kingdom breaking out as large blocks.

Where Ontario's exports go

Ontario's domestic exports to 216 destinations since 2000, one dot per $150 million. The US share fell from 93.2% to 71.6% as gold surged.

See the example

Map of Ontario made of dots, one for every Ontario Trillium Foundation grant since 1999, coloured by year. Southern Ontario is densest; 2,325 province-wide grants sit in a labelled group beside the map.

Ontario community grants since 1999

Every Ontario Trillium Foundation grant since 1999: 32,994 grants and $2.95B, one dot each.

See the example

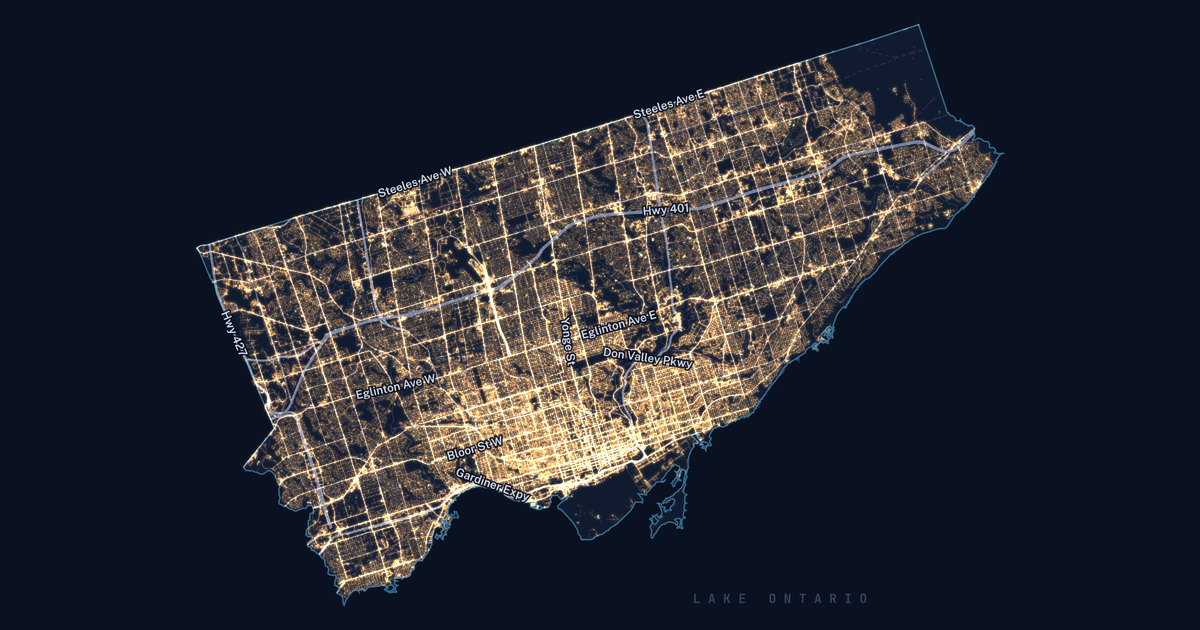
Toronto at night, each glow one of the City's 213,618 streetlight poles, brightest downtown, with major roads labelled.

Toronto Grid Pulse

213,618 streetlight poles, 4,439 active development sites, 82 City-run chargers and 688,335 street trees on one real map of Toronto, with a narrated tour for each.

See the example