Home Examples Surrey City Centre

LIVE EXAMPLE - OPEN DATA

What is being built near SkyTrain in Surrey City Centre

Every development application the City of Surrey has on record in City Centre, 950 in all and 115 of them active, mapped on its parcel with real walking times to the three Expo Line SkyTrain stations. 74 of the 115 active applications are within a 10 minute walk of a station.
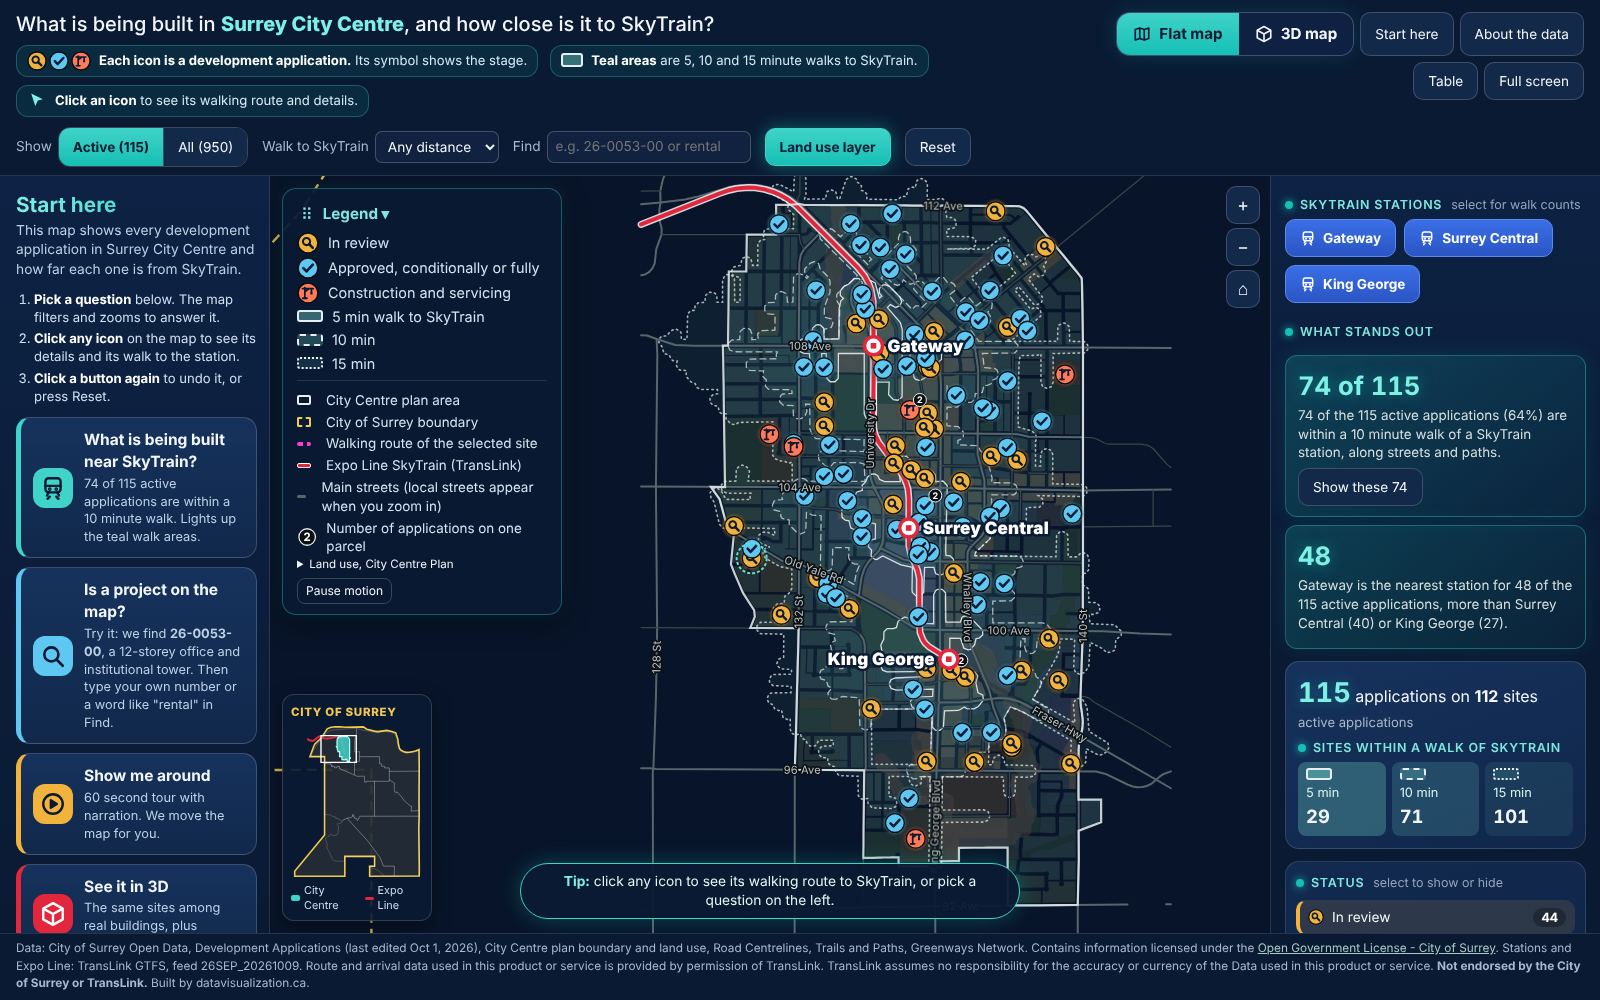
Development applications in Surrey City Centre with walking times to SkyTrain along City streets and paths. Data: City of Surrey Open Data, Open Government License - City of Surrey; TransLink GTFS. Not endorsed by the City of Surrey or TransLink.

950

development applications on record in City Centre

115

of them are active right now

64%

of active applications are within a 10 minute walk of SkyTrain

3

Expo Line stations: Gateway, Surrey Central and King George

What the data reveals

NEAR SKYTRAIN

Most active projects are a short walk from a station

74 of the 115 active applications (64%) are within a 10 minute walk of an Expo Line station, measured along City of Surrey streets and paths at 80 m a minute, and 31 are within 5 minutes.

GATEWAY

Gateway is the busiest station area

Gateway is the nearest station for 48 of the 115 active applications, more than Surrey Central (40) or King George (27).

APPROVED

More than half are already approved

66 of the 115 active applications (57%) are approved, conditionally or fully. 44 are in review and 5 are in construction and servicing. The City's own status is shown on every site.

LAYERS OF HISTORY

Many parcels have been here before

The 950 applications on record sit on 836 parcels. 81 parcels carry more than one application, up to 6 on a single site, and every one of them is listed when you open that site.

INTERACTIVE

How to explore it

Click any site

Its parcel lights up, its walking route to the nearest station draws on the map, and a card opens with the City's status, description and links.

Pick a station

Select Gateway, Surrey Central or King George to see its own 5, 10 and 15 minute walks and how many sites fall in each.

Start with a question

Big buttons answer the common questions, and a 60 second narrated tour moves the map for you. Click a button again to undo it.

Find a project

Type a project number such as 26-0053-00, or any word in the descriptions, like rental or tower.

See it in 3D

Switch to Google's 3D map to see the same sites among Surrey's real buildings, and raise each area by the density the City Centre Plan allows.

Read it as text

Open the Table for all 950 applications, sortable, or move between sites with the arrow keys. Every change is announced.

About the data

Every figure on this page and on the map is counted from the City of Surrey's published development applications, and checked by the build so a change in the source data cannot slip through unnoticed.

  • Source: City of Surrey Open Data, Development Applications (13,878 records citywide, last edited Oct 1, 2026), pulled October 15, 2026. Open Government License - City of Surrey.
  • City Centre is the City's own outline from its Secondary Plan Boundaries layer. An application is included when its parcel lies inside it: 950 applications on 836 parcels.
  • Status is shown exactly as the City publishes it. For colour only, statuses are grouped into in review, approved, construction and servicing, concluded, and closed or withdrawn. Active means not concluded or closed.
  • The data has no application date and no project type, so neither is shown or guessed. Descriptions are shown as published.
  • Walking times follow the City's Road Centrelines, Trails and Paths, and Greenways Network at 80 m a minute (4.8 km/h), without highways, ramps or rail. They are calculated, not measured.
  • The City's project-page links lost their & character in the published data; the links on the map restore that one character so they open.
  • SkyTrain stations and the Expo Line: TransLink GTFS feed 26SEP_20261009. Route and arrival data used in this product or service is provided by permission of TransLink. TransLink assumes no responsibility for the accuracy or currency of the Data used in this product or service.
  • The 3D view uses Google's photorealistic map. Planned density is the City Centre Plan's maximum floor area ratio, not building height.
  • A one-page guide to every part of the map: Guide to the page (PDF).
  • Not endorsed by the City of Surrey or TransLink.
Have sites, permits or projects to map?

Development applications, capital projects, facilities or listings: we put them on a real map people can explore, with walking times, filters and every figure traceable to its source. Tell us about your data.

More examples

Map of Ontario made of dots, one for every Ontario Trillium Foundation grant since 1999, coloured by year. Southern Ontario is densest; 2,325 province-wide grants sit in a labelled group beside the map.

Ontario community grants since 1999

32,994 Ontario Trillium Foundation grants, one dot each.

See the example

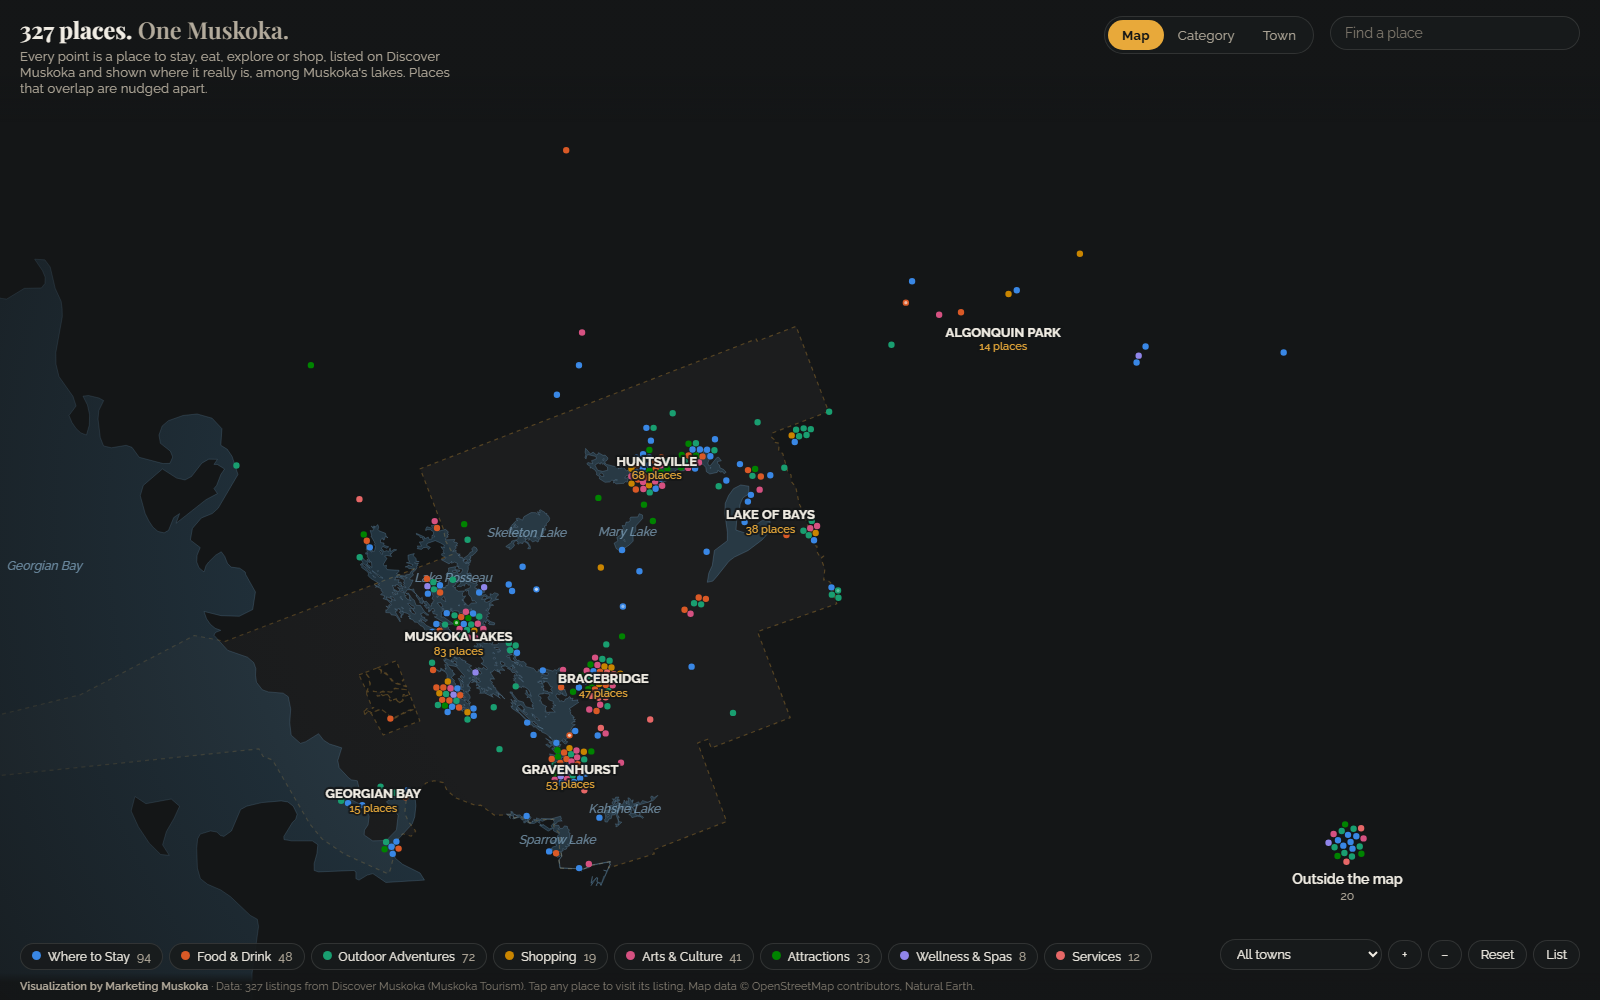
Map of Muskoka with coloured dots for tourism listings placed among the real lakes, grouped by town: Muskoka Lakes, Huntsville, Gravenhurst, Lake of Bays and more.

Muskoka tourism

327 tourism listings mapped among Muskoka's real lakes.

See the example

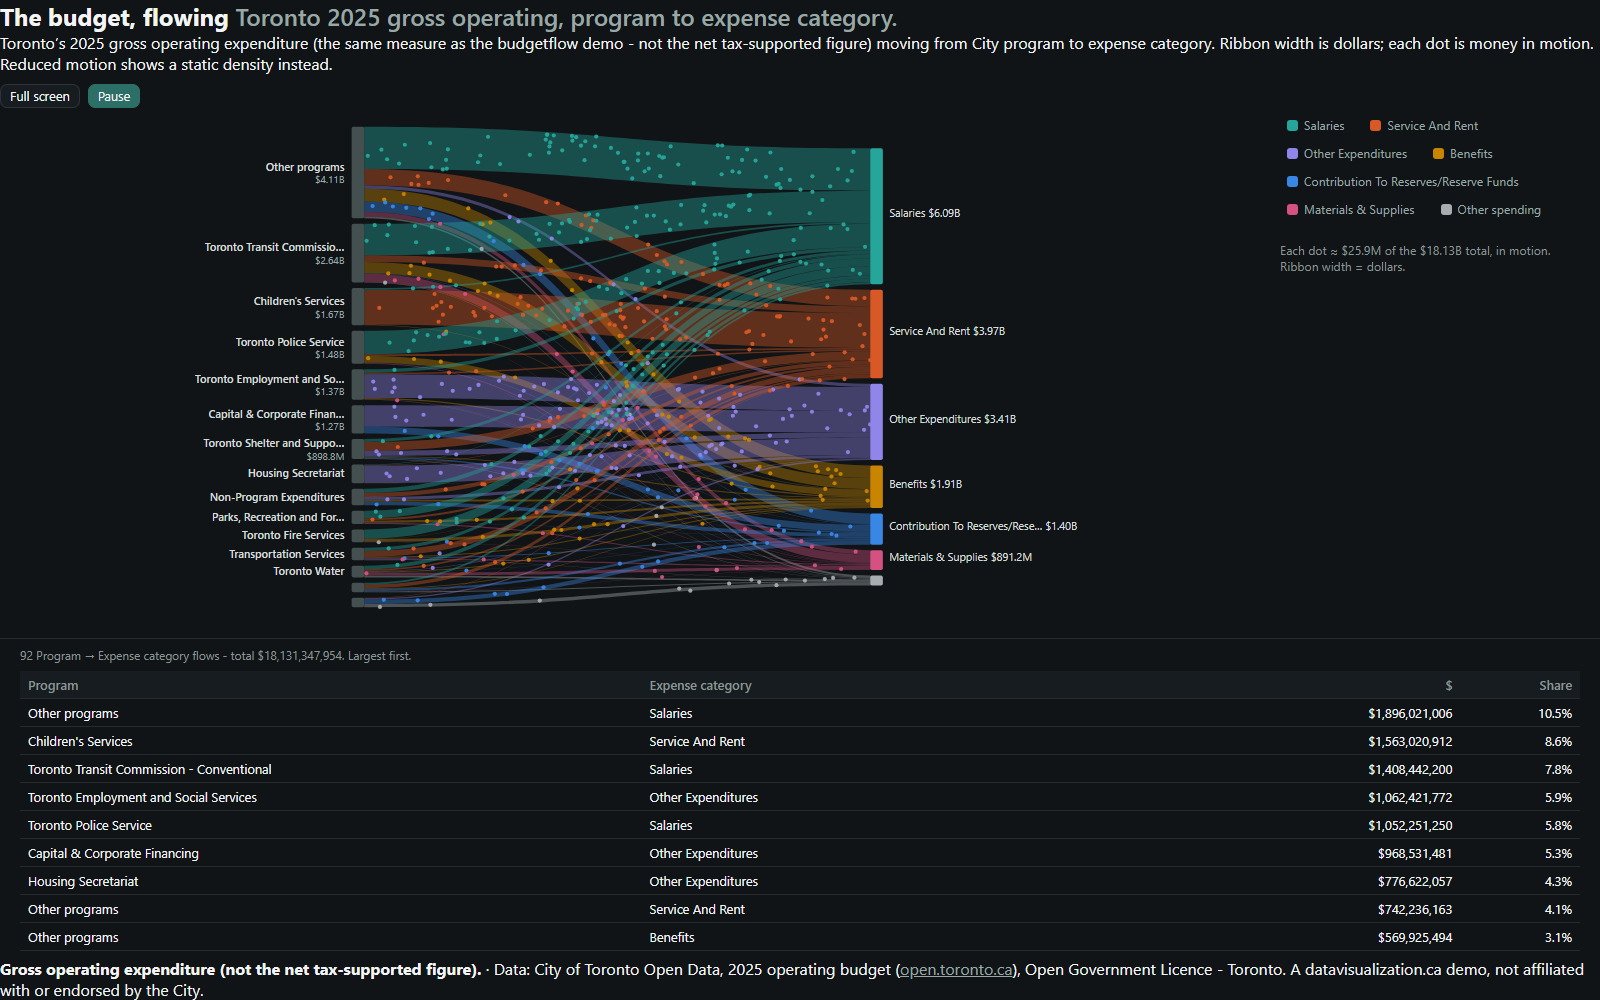
Flow diagram: Toronto's 2025 gross operating budget moving from 15 program groups on the left to 7 expense categories on the right. Salaries is the widest stream at $6.09B.

Toronto budget

Toronto's $18.13 billion 2025 operating budget, flowing from programs to costs.

See the example