Home Examples Down the Escarpment

LIVE EXAMPLE - TOURISM

Down the Niagara Escarpment by ship

A freighter's 12 hour trip through the Welland Canal on a 3D satellite map: 8 locks and 99.5 m down the Niagara Escarpment from Lake Erie to Lake Ontario, told in four narrated tours with a live elevation staircase, lock cards and 67 seasons of Seaway traffic.
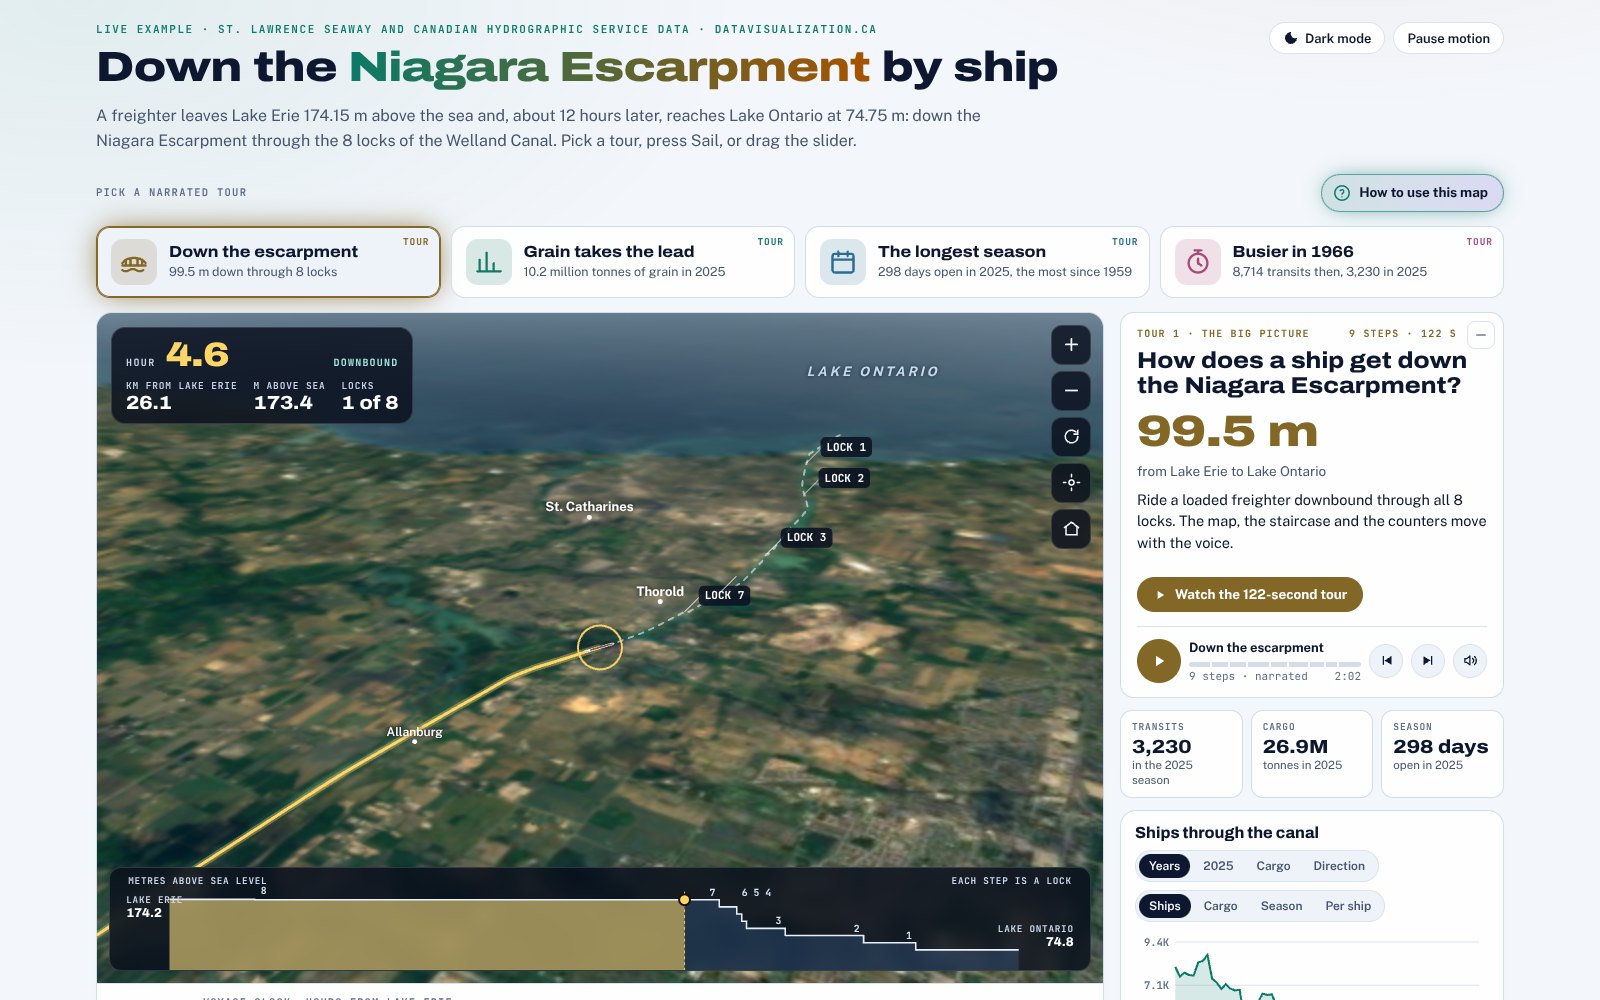
The Welland Canal from Lake Erie to Lake Ontario, with the ship's height above sea level, its locks and 67 seasons of traffic. Data: St. Lawrence Seaway Management Corporation traffic reports and canal facts; lake levels from the Canadian Hydrographic Service, Open Government Licence - Canada; map from OpenStreetMap (ODbL), Sentinel-2 cloudless 2016 by EOX (CC BY 4.0) and NRCan CDEM terrain. Narration voiced with ElevenLabs and Microsoft Edge text to speech. Not endorsed by the St. Lawrence Seaway Management Corporation.

99.5 m

down from Lake Erie to Lake Ontario

8 locks

in 43.4 km, about 12 hours by ship

3,230

transits in 2025, carrying 26.9 million tonnes

298 days

in 2025, the longest of 67 seasons since 1959

What the data reveals

THE BIG PICTURE

Down the escarpment

Lock 8 only trims the level, 0.75 m today. Then come seven lift locks of about 14.2 m each, three of them joined in the twinned Flight Locks, which drop a ship 42.28 m in 0.81 km.

THE LEADER

Grain takes the lead

Grain carried 10.2 million tonnes in 2025, 38.0% of the cargo, just ahead of mine products at 37.3%. It is the first time in the Seaway's 20-year table that farm products came first.

THE PATTERN

The longest season

The canal closes for winter. In 2025 it ran from March 22 to January 13, 298 days. June carried the most cargo, November the most ships, and December brought the grain rush.

THE SURPRISE

Busier in 1966

The record was 8,714 transits in 1966. In 2025 there were 3,230, 62.9% fewer, but each one carried 8,341 tonnes against 6,171, about 35% more.

INTERACTIVE

How to explore it

Take a narrated tour

Four tours of one to two minutes. The camera, the ship, the staircase and the counters move with the voice, and every word appears on screen as a caption.

Sail the canal

Press Sail, drag the hour slider or jump to any lock. The ship moves at the published pace, 45 minutes in each lock and 12 hours end to end, and the elevation staircase steps down with it.

Fly the map

Drag, zoom and turn the 3D map, or let the camera follow the ship. Detail cards open at the locks and landmarks along the way.

Follow the walkthrough

Press How to use this map for a narrated, self-playing tour of every control on the page.

Light or dark

Switch between light and dark, or let the page follow your device. One button pauses every animation.

Charts and tables

The traffic chart shows 67 seasons of transits, tonnes and season length, plus the 2025 months and cargo. Tables list every lock and every season as text.

About the data

Every figure on the page is computed from published sources and checked when the page is built.

  • Traffic: St. Lawrence Seaway Management Corporation and Great Lakes St. Lawrence Seaway traffic reports (2025, 2005 and the 1959 to 1992 historical tables): 67 seasons of transits, tonnes and season length.
  • Canal: SLSMC Welland Canal fact sheet and Facts and Figures: 99.5 m, 43.4 km, 8 locks, a 12 hour transit and 45 minutes a lock.
  • Lake levels: Canadian Hydrographic Service gauges at Port Colborne and Port Weller, daily mean for November 2, 2026.
  • Map: OpenStreetMap contributors (ODbL); Sentinel-2 cloudless 2016 by EOX IT Services (CC BY 4.0); terrain from Mapzen Terrain Tiles with NRCan CDEM.
  • Method: the voyage is a model, not a real ship's track: 45 minutes in each lock and the rest of the 12 hours spread evenly over the channel. Locks 7 to 1 are drawn as equal steps between today's gauge levels; captions quote the Seaway's 14.2 m average.
  • Narration voiced with ElevenLabs (tours 1 to 3) and Microsoft Edge text to speech (tour 4 and the walkthrough).
  • Contains information licensed under the Open Government Licence - Canada. Not endorsed by the St. Lawrence Seaway Management Corporation.
Have a route, a trail or a place to explain?

Canals, trails, heritage routes, visitor numbers or seasons: we turn them into a map people can explore, with narrated tours, tables and keyboard access, and every figure traceable to its source. Tell us about your data.

More examples

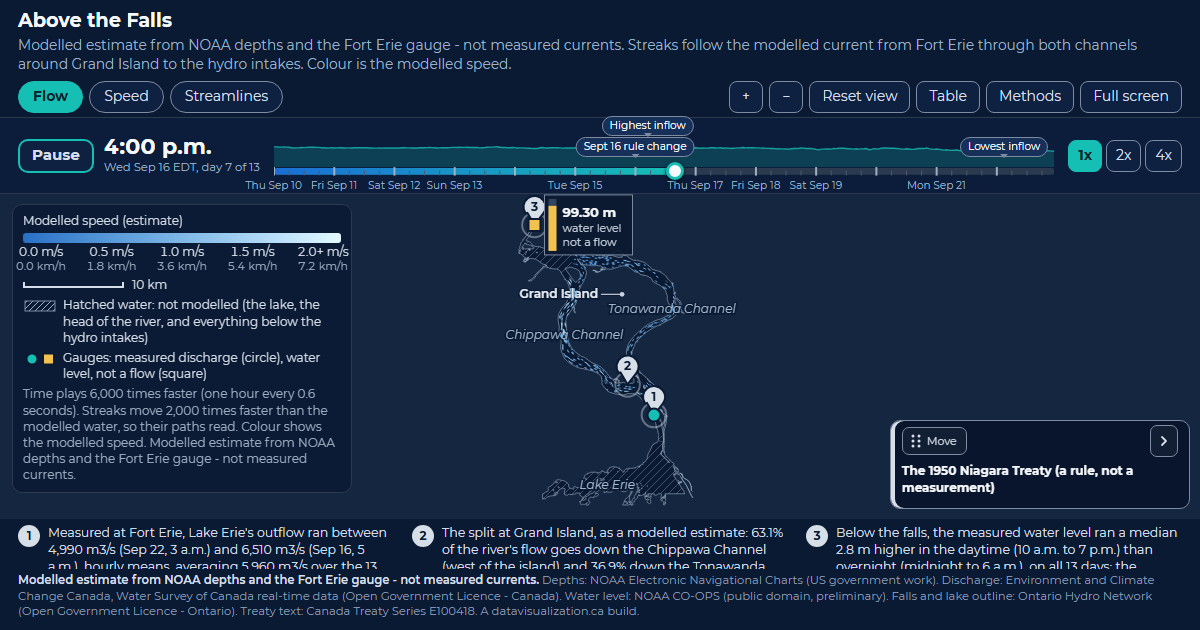
Card for the Above the Falls example.

Above the Falls

Lake Erie's water around Grand Island to the hydro intakes. Modelled, 63.1% takes the Chippawa Channel; the published figure is about 60%.

See the example

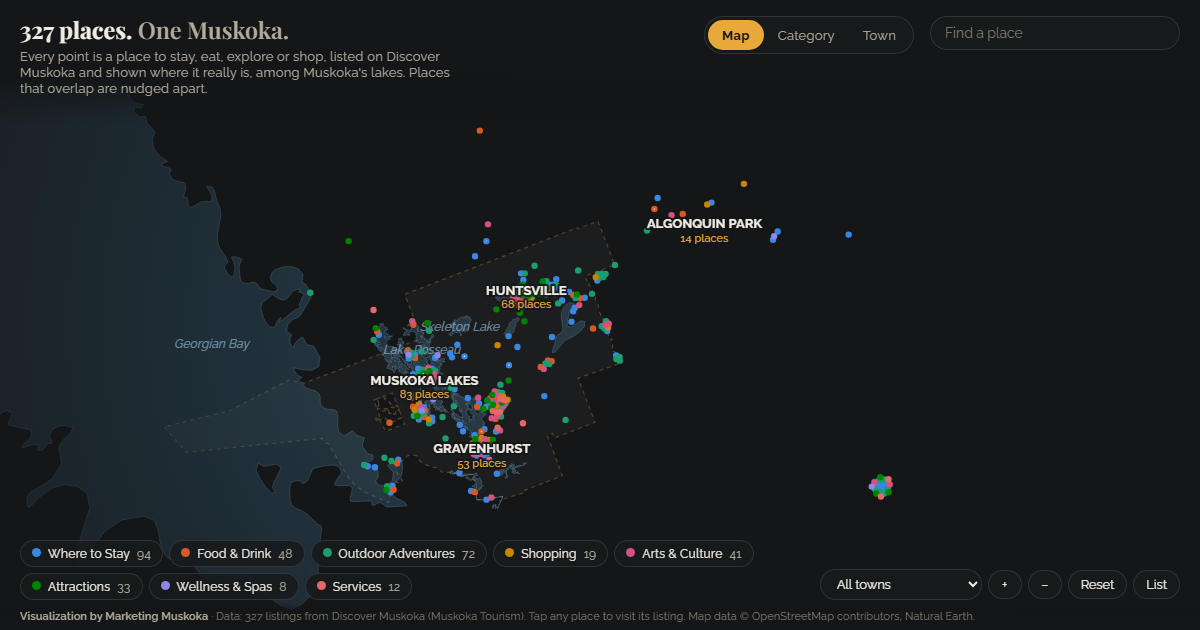
Card for the Muskoka tourism example.

Muskoka tourism

327 tourism listings among Muskoka's real lakes, explored by category and by town.

See the example

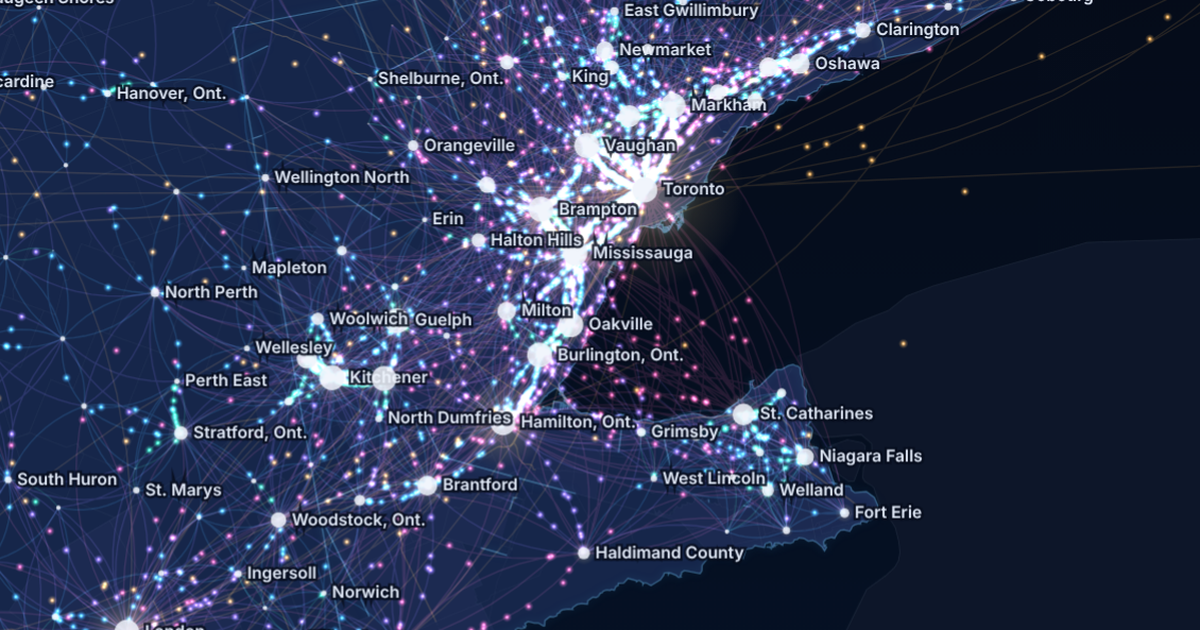
Canada Commutes: the Golden Horseshoe at night, glowing streams of commuters between Toronto, Brampton, Mississauga, Hamilton, Kitchener and Niagara.

Canada Commutes

Every town-to-town commute in the 2021 Census on one animated map of Canada, with four narrated tours and live traffic cameras.

See the example