Home Industries Healthcare Organizations

INDUSTRIES

Data Visualization for Healthcare Organizations

We turn service, access and population health data into clear interactive charts and maps that patients, boards and funders can explore on their own.

THE CHALLENGE

Clear data builds trust in care

Healthcare organizations hold important data: service volumes, wait times, program reach, population health and access. It is often reported in long PDFs and dashboards built for analysts, not for patients, families or boards.

A clear, accessible visualization shows communities what is available and how services are doing, using only grouped, privacy-safe data.

TODAY

  • Annual reports and board decks as static PDFs
  • Service data spread across many systems
  • Communities unsure where to go or how long they will wait

WITH AN INTERACTIVE VISUALIZATION

  • Clear maps of services and access
  • Trends boards and funders can follow
  • Built for everyone, WCAG 2.1 AA

Questions patients and boards ask

WHAT WE BUILD

What we build for healthcare

Service and wait time trends

Volumes and wait times over months and years, grouped and privacy-safe, with a text table behind every chart.

Access and catchment maps

Where services are and how long it takes to reach them on foot, by transit or by car.

Population health profiles

Shaded maps of public health and census measures by neighbourhood or region.

Funding and spending flows

Where the money comes from and where it goes, program by program.

Program reach and impact

Who your programs reach and where, for funders, boards and annual reports.

Branded board reports

Staff download a branded PDF or PowerPoint of the exact view for a board or funder meeting.

LIVE EXAMPLES

The same techniques, working today

These live examples use public data from other sectors, but the techniques are the ones we bring to healthcare: travel, walking access, spending flows and program reach. Every number comes from the published source.
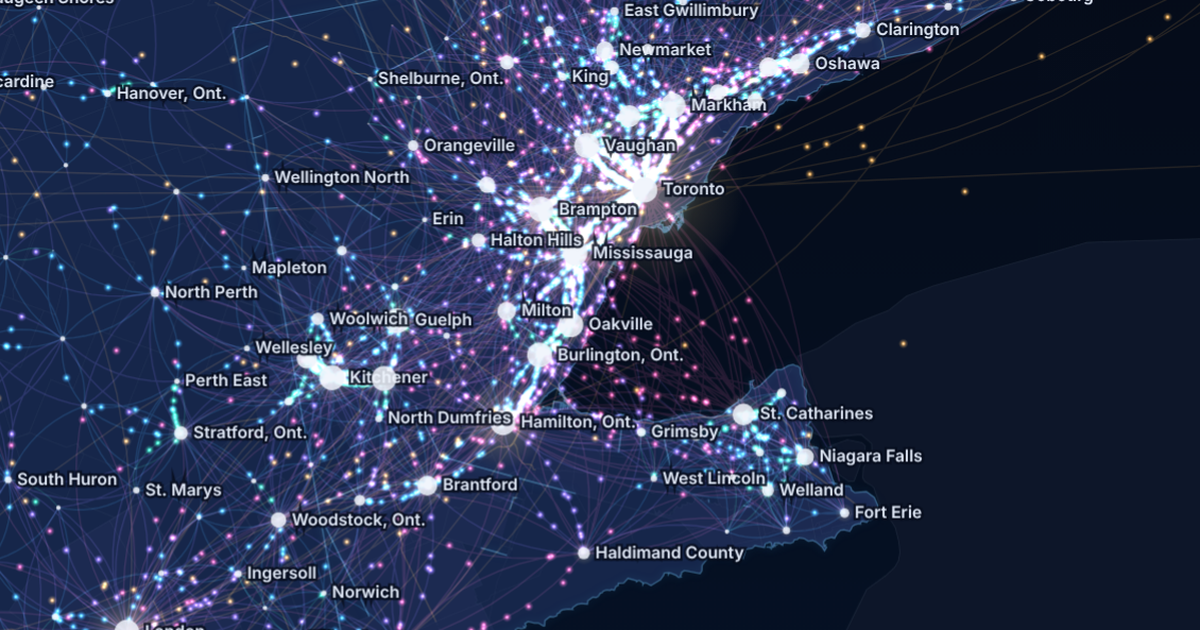
Canada Commutes: the Golden Horseshoe at night, glowing streams of commuters between Toronto, Brampton, Mississauga, Hamilton, Kitchener and Niagara.

ACCESS - TRAVEL

Canada Commutes

Every town-to-town commute in the 2021 Census on one animated map: 4,287,965 people crossing a town line to work.

See the example

Toronto Grid Pulse: every streetlight pole in Toronto as a glowing dot on the City's mapping, brightest downtown, with major roads labelled.

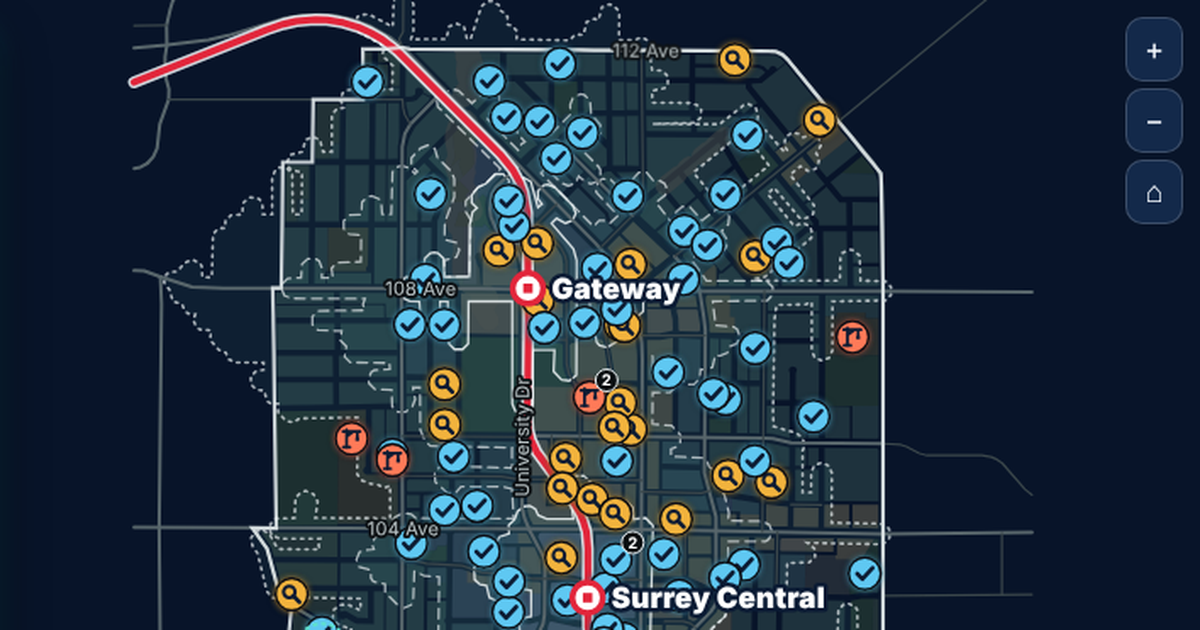
ACCESS - WALKING TIMES

Surrey City Centre

950 development applications on their parcels, with real walking times to three SkyTrain stations.

See the example

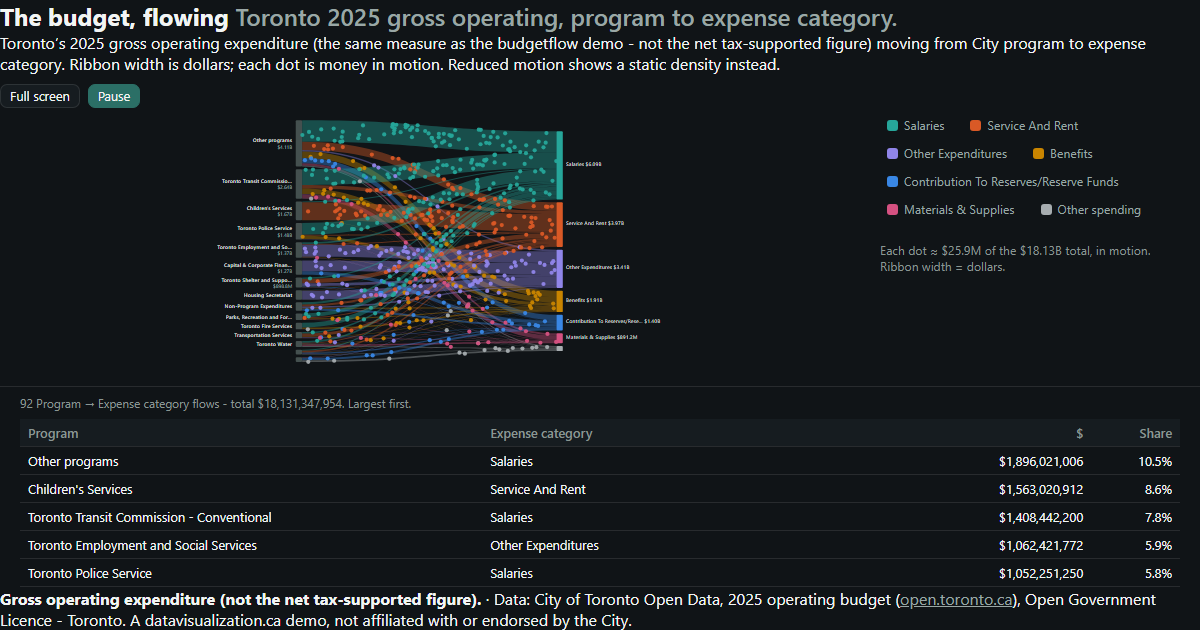
Toronto's 2025 operating budget flowing from programs to expense categories.

FUNDING - SPENDING FLOWS

Toronto Budget

$18.13 billion of 2025 operating spending, flowing from City programs to what the money buys.

See the example

Map of Ontario made of dots, one for every Ontario Trillium Foundation grant since 1999, coloured by year. Southern Ontario is densest; 2,325 province-wide grants sit in a labelled group beside the map.

PROGRAMS - REACH

Ontario Community Grants

Every Ontario Trillium Foundation grant since 1999: 32,994 grants and $2.95 billion, one dot each.

See the example

YOUR DATA

Built from data you already report

Most organizations already report the numbers that matter. We work only with grouped, de-identified data, and if it fits in a spreadsheet, it can be visualized.

  • Service volumes by month
  • Wait time summaries
  • Program enrolment and reach
  • Site and clinic locations
  • Population health indicators
  • Census neighbourhood profiles
  • Funding and spending
  • Patient experience survey results
  • Staffing summaries
  • Transit and travel times

AODA / WCAG 2.1 AA

Accessible care starts online, AODA included

Ontario's AODA requires public sector organizations, and private and nonprofit organizations with 50 or more employees, to make their websites meet WCAG 2.0 Level AA. Every visualization we build meets WCAG 2.1 AA, a newer and stricter standard, so patients and families of all abilities can use it.

Text table behind every chart

Every number can be read without the picture

Full keyboard access

Every control works without a mouse

Screen reader announcements

Changes are read out as people explore

Reduced motion respected

Animation can be paused or turned off

WCAG 2.1 AA on every build

WAYS TO WORK WITH US

Build, licence, or both

Every project is quoted after a discovery call. Here is how healthcare organizations usually work with us.

Custom build

We design and build a visualization around your services, your data and your community, ready to embed on your site.

Licence

Use one of our ready-made visualizations with your own data and branding, on a monthly or yearly plan.

Build and licence

A custom build to start, then a licence that keeps it hosted and refreshed as new reporting periods close.

HOW IT WORKS

From first call to launch

1

Discovery call

Tell us who needs to understand your data and what you report today. We suggest what the experience could look like.

2

Scope and quote

We review the data, confirm it is grouped and privacy-safe, check what it can honestly show, and send you a quote.

3

Build and review

You see a working draft early, and we refine it with your team and privacy office.

4

Launch and update

It goes live on your website and can be refreshed each reporting period.

Questions healthcare teams ask us

We only work with grouped, de-identified data, never records about individual patients. Small counts are suppressed or combined so no one can be identified.
Our public examples use open data from other sectors. The techniques are the same ones we bring to healthcare, and we are happy to walk you through them on a discovery call.
Yes. Each visualization is a single web page that embeds on almost any website or intranet, and it can be shared with one link.
Yes. Every build meets WCAG 2.1 AA, with full keyboard access, screen reader support and a text version of every chart.
Every project is quoted. The price depends on the size and condition of your data, the number of views, and features like maps, tours or downloadable reports. See what affects pricing, or book a discovery call for a quote.

Help your community understand its care

Tell us what you report and who needs to understand it. We will show you what an interactive experience could look like and what it takes to build it.