Examples Nonprofits and funders OTF grants since 1999

LIVE EXAMPLE - OPEN DATA

Where Ontario's community grants have gone since 1999

Every grant the Ontario Trillium Foundation has approved since 1999-2000 is published as open data: one spreadsheet, 32,994 rows. Useful, but nobody reads 32,994 rows. Here every grant is one dot you can sort, search and explore.

The interactive opens on click and works with a keyboard and screen reader. Prefer text? Use its List view: every grant in a searchable table.

32,994

grants approved, each one a dot

$2.95B

awarded since 1999-2000

28

fiscal years, 1999-2000 to 2026-27

16

OTF catchment areas on the map

What the data reveals
FEWER, BIGGER GRANTS

The yearly total held steady. The number of grants did not.

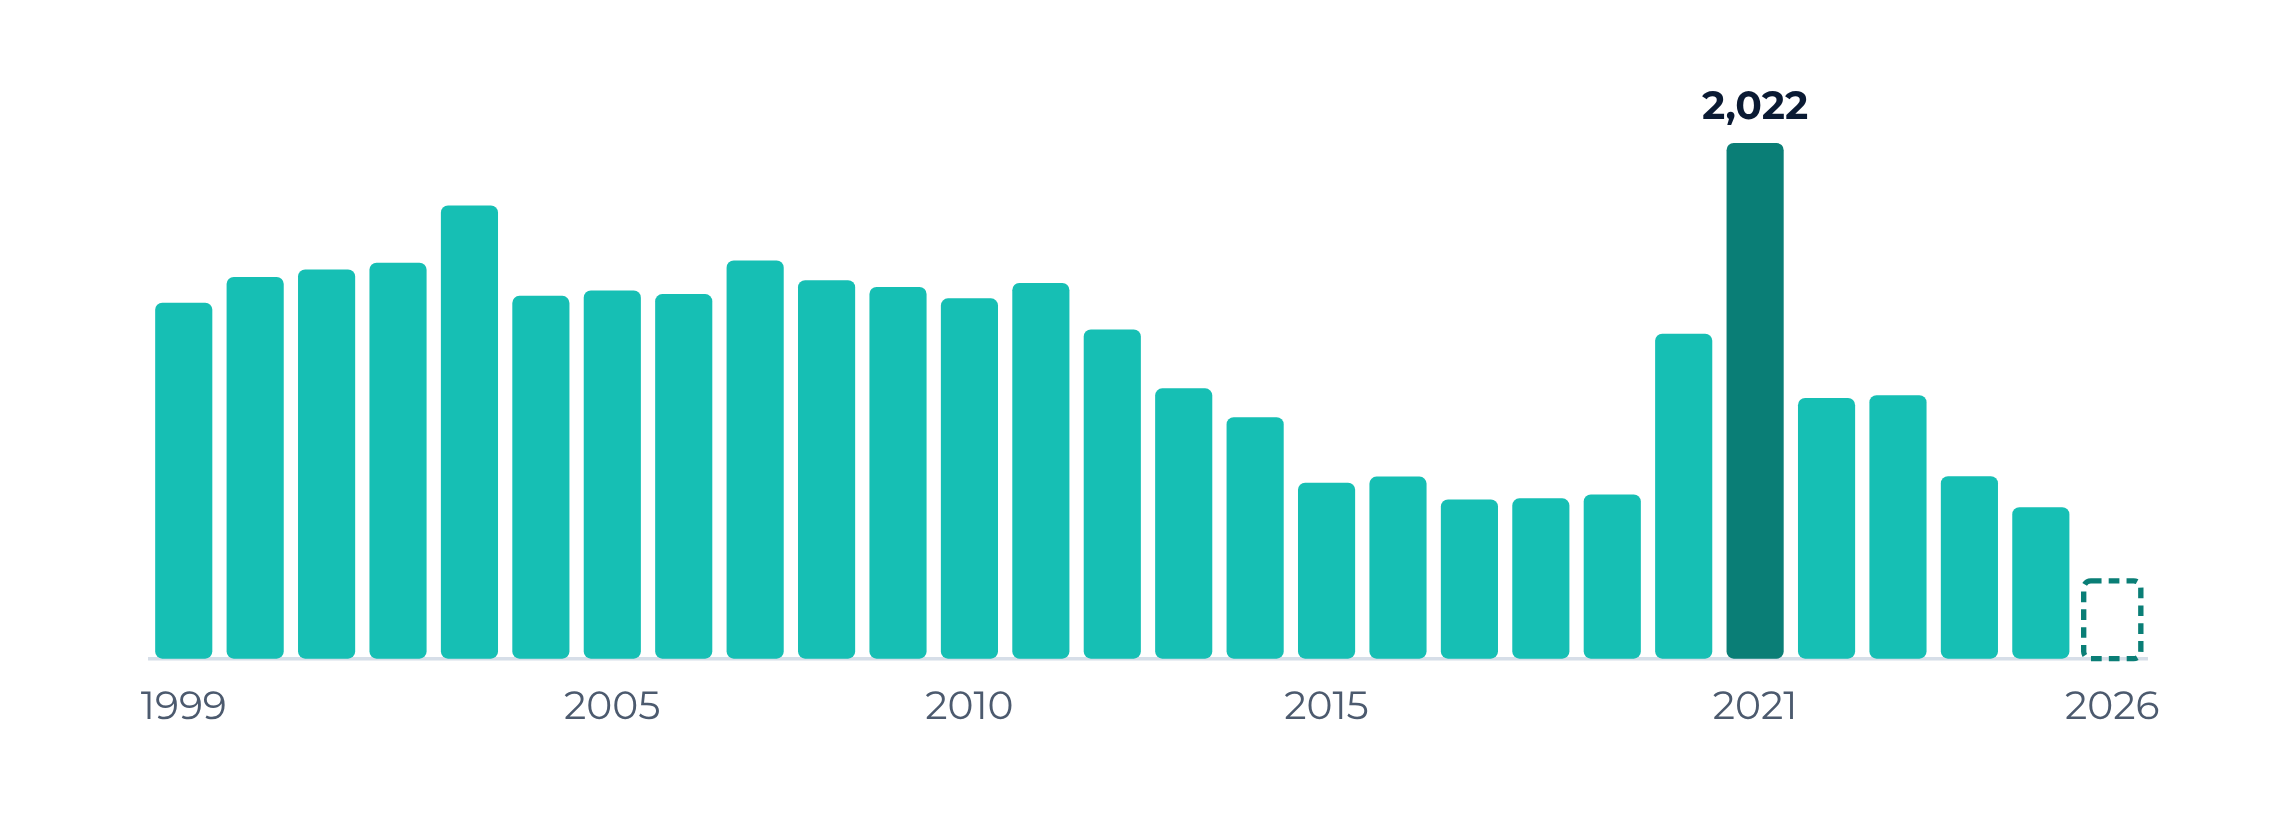
In the 2000s the Foundation approved about 1,500 grants a year, averaging about $66,000 each. From 2015 to 2019 it approved about 660 a year, averaging about $169,000, while the yearly total stayed between $108M and $115M.

Bar chart of grants approved per fiscal year, 1999-2000 to 2026-27. About 1,400 to 1,800 a year through 2011-12, falling to about 600 to 700 a year from 2015-16 to 2019-20, a peak of 2,022 in 2021-22, and 305 so far in 2026-27, which is still in progress.

Grants approved per fiscal year, labelled by the year it starts. Dashed bar: 2026-27, still in progress.

Grants approved per fiscal year
Fiscal yearGrants
1999-001,396
2000-011,496
2001-021,526
2002-031,553
2003-041,776
2004-051,422
2005-061,444
2006-071,430
2007-081,561
2008-091,484
2009-101,458
2010-111,412
2011-121,473
2012-131,291
2013-141,060
2014-15947
2015-16690
2016-17714
2017-18624
2018-19629
2019-20644
2020-211,274
2021-222,022
2022-231,022
2023-241,033
2024-25715
2025-26593
2026-27 (in progress)305

ONE YEAR STANDS OUT

2021-22: $202.1M across 2,022 grants

Nearly double a typical year. It is the peak in both dollars and number of grants. Switch the map to Years and it jumps out.

MOSTLY COMMUNITY-SCALE

59% of grants are under $75,000

The median grant is $58,300. Only 471 grants, about 1 in 70, are $500,000 or more. The Amount view sorts every grant into these bands.

WHERE THE MONEY WENT

Toronto leads with $484.7M, 16% of the total

Close behind: $479.5M in 2,325 grants that are province-wide or span several catchments. They sit in their own labelled group, never placed on one region.

INTERACTIVE

How to explore it

Four views, one set of dots

Map, Program, Years and Amount. Every grant flies to its new place, so you can follow it.

Colour by year or by focus

Year runs from 1999 (dim) to 2026 (bright). Action area shows the six areas OTF has used since 2015.

Story mode

A short guided tour through the headlines, one step at a time.

Every grant, as text

List view is a searchable table of all 32,994 grants, fully usable with a keyboard and screen reader.

About the data

Source: the Ontario Trillium Foundation's open data on approved grants, 1999-2000 to present, published under the Open Government Licence - Ontario. Map boundaries: Statistics Canada census divisions combined into OTF's 16 catchment areas (Open Government Licence - Canada). Not affiliated with or endorsed by the Ontario Trillium Foundation.

  • Every approved grant in the file is shown. None were dropped.
  • Dollars are the amounts awarded, as published, not adjusted for inflation.
  • Each dot sits at a random point inside its catchment. Its position is not a street address.
  • OTF changed how it labels its work in 2015. Grants before then show the four sectors OTF used at the time; we did not guess how they map to today's action areas.
  • 2026-27 is still in progress, so it is shown apart and left out of the year-to-year comparisons.
Could your data look like this?

Grants, budgets, members, listings, locations. If it fits in a spreadsheet, we can turn it into something people want to explore. Tell us about your data and who needs to understand it.

More examples

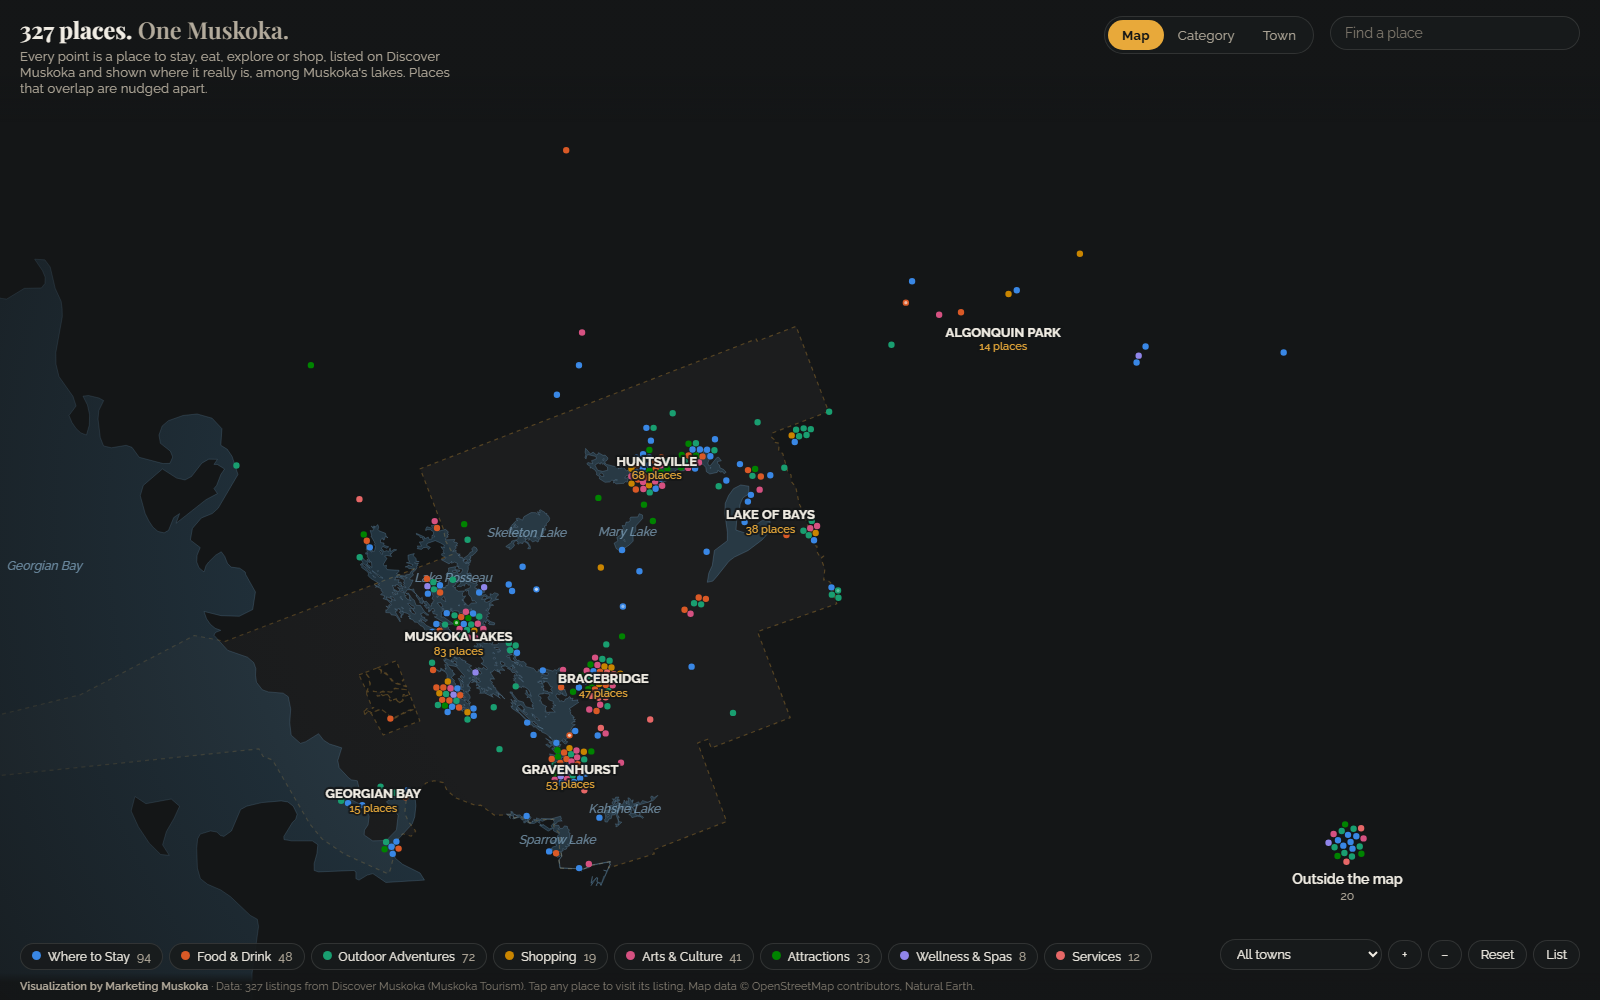
Map of Muskoka with coloured dots for tourism listings placed among the real lakes, grouped by town: Muskoka Lakes, Huntsville, Gravenhurst, Lake of Bays and more.

Muskoka tourism

Muskoka's tourism listings on a real map of its lakes, each placed by its own listing's coordinates.

See the tourism example

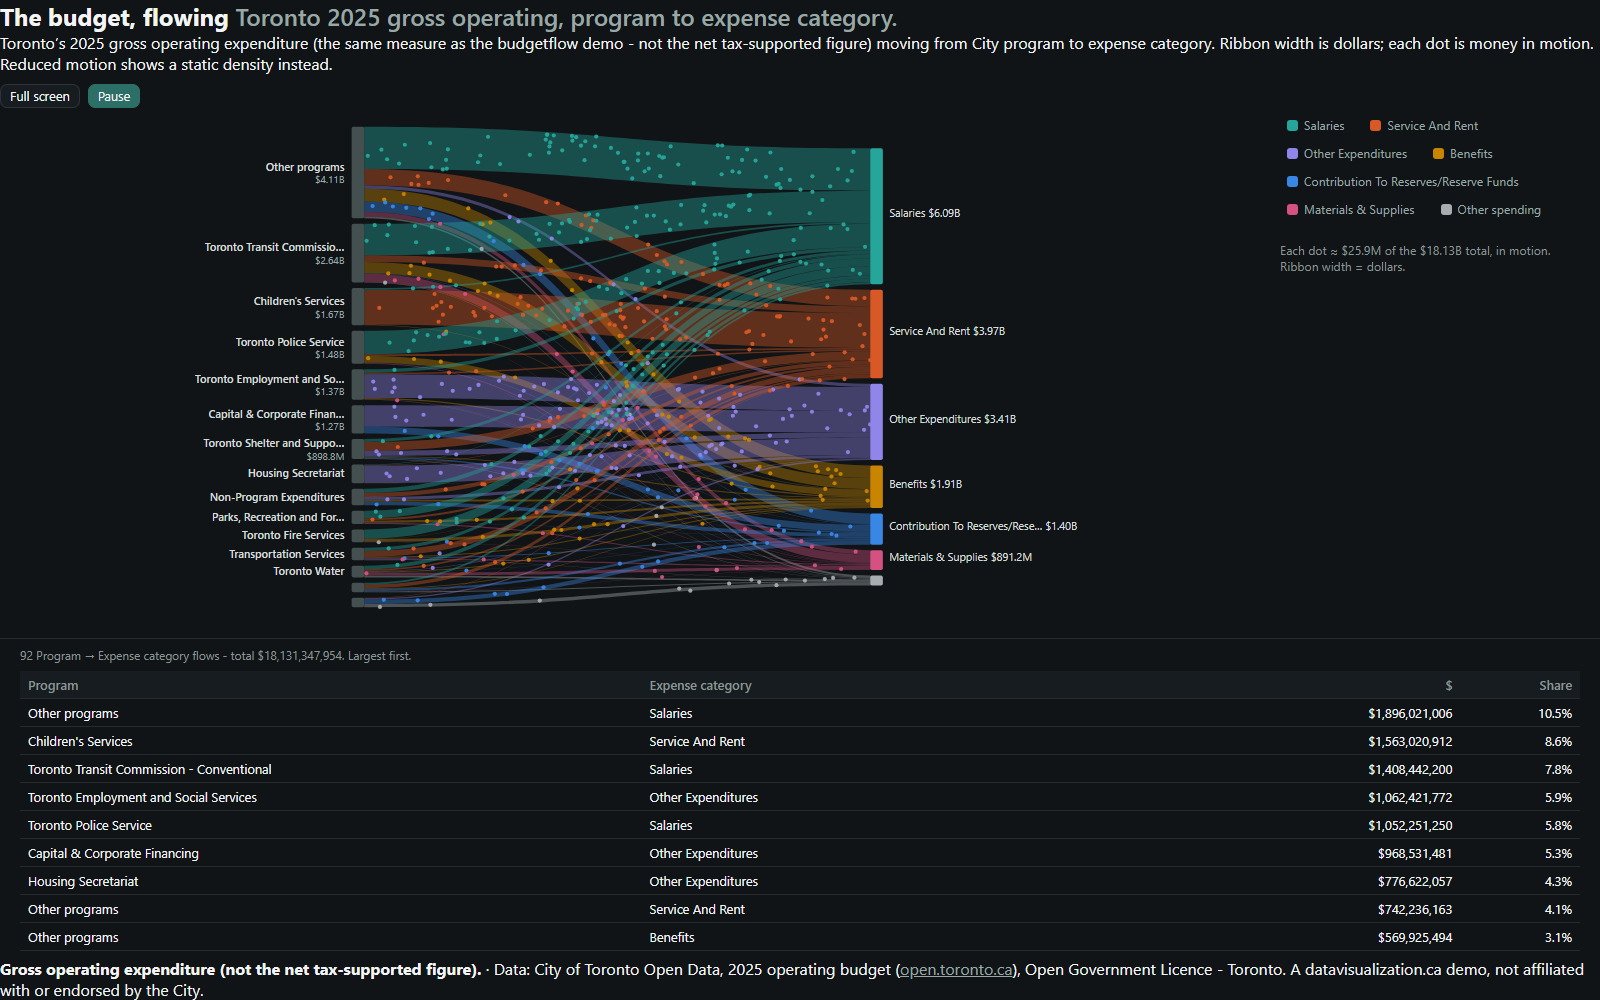
Flow diagram: Toronto's 2025 gross operating budget moving from 15 program groups on the left to 7 expense categories on the right. Salaries is the widest stream at $6.09B.

A city budget, in motion

Toronto's 2025 gross operating budget, flowing from City programs to what the money is spent on.

See the municipal example

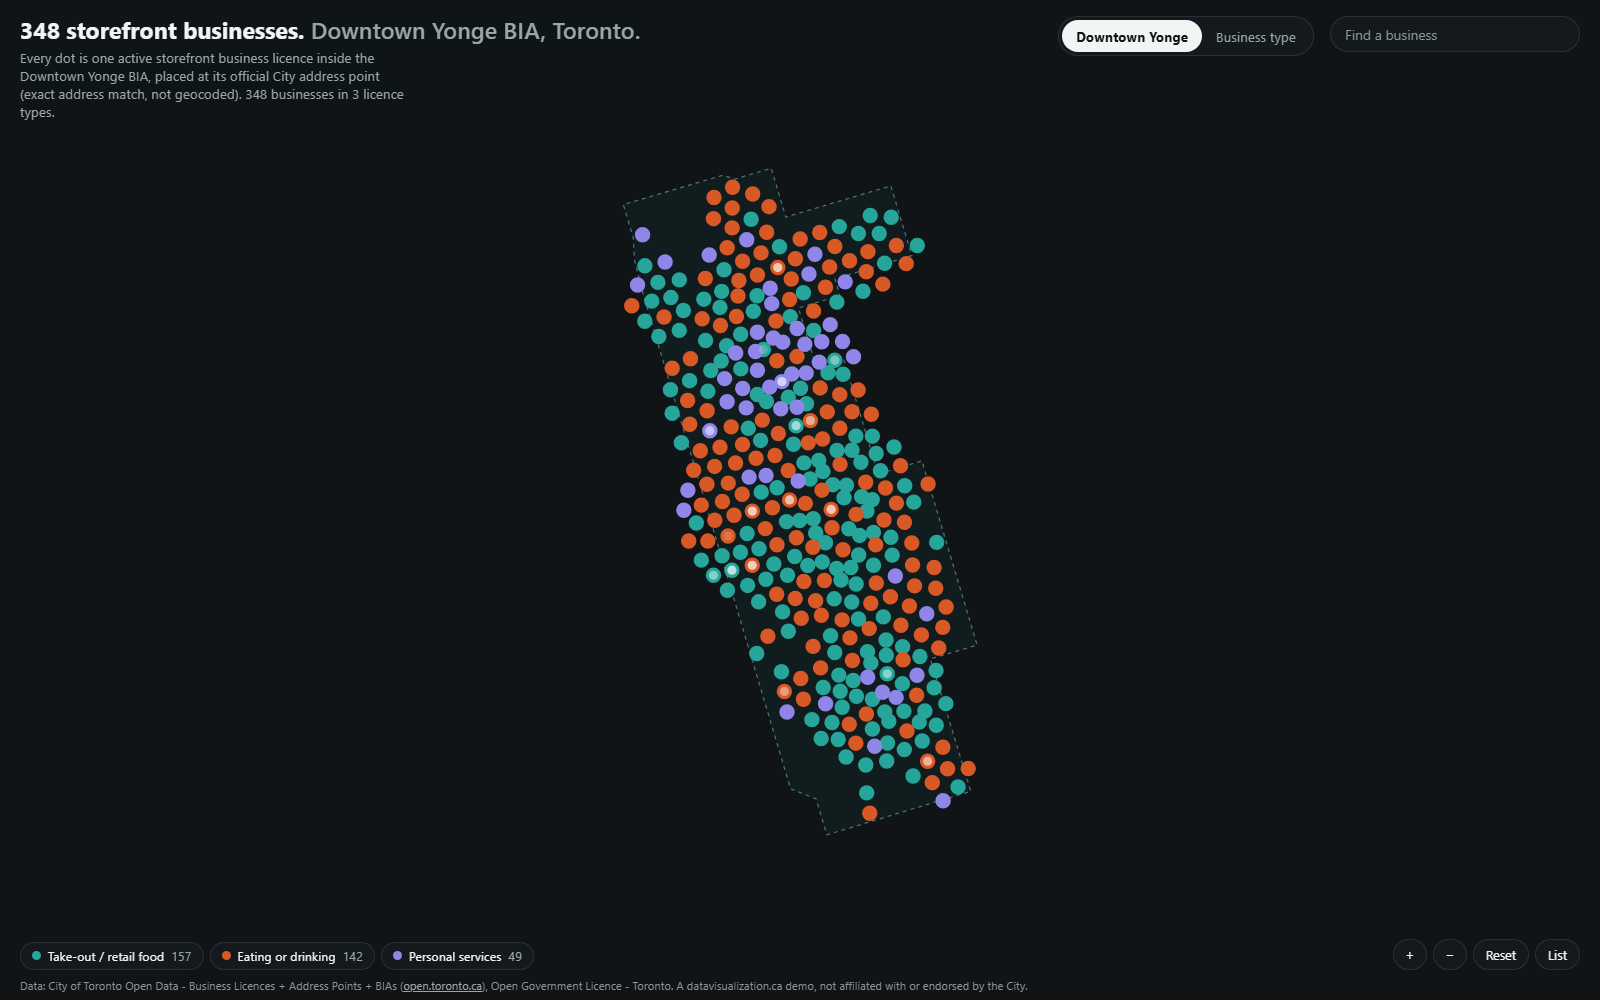
Map of the Downtown Yonge BIA boundary filled with 348 dots, one per storefront business, coloured by licence type.

Business Improvement Areas

348 storefront businesses in Toronto's Downtown Yonge BIA, each placed at its official City address.

See the BIA example