Home Industries Research Firms & Universities

INDUSTRIES

Data Visualization for Research Firms and Universities

We turn findings, datasets and models into interactive charts and maps that funders, partners and the public can explore on their own, with the method in plain view.

THE CHALLENGE

Good research deserves to be seen

Research teams produce careful work: surveys, models, field measurements and long-term datasets. Most of it is published as a paper, a report or a data file, and reaches a small audience of specialists.

An interactive visualization opens your findings to funders, partners, students and the public, with the method, the sources and the uncertainty shown honestly.

TODAY

  • Findings published only as papers and PDFs
  • Datasets shared as files few people open
  • Funders asking for broader reach and impact

WITH AN INTERACTIVE VISUALIZATION

  • Interactive charts and maps of your findings
  • Anyone can explore the data themselves
  • Open to everyone, WCAG 2.1 AA

Questions funders and the public ask

WHAT WE BUILD

What we build for researchers

Findings explorers

Your key results as interactive charts with notes, sources and confidence shown, not hidden.

Model and simulation viewers

Model output like currents, wind or spread animated on a real map, labelled as modelled.

Survey and census maps

Shaded maps of survey or census results by region, with the margin of error in the tooltip.

Long-term trends

Decades of measurements animated over time, with exact values and a text table behind every chart.

Open data portals

A friendly front door to your published dataset, so people can explore before they download.

Branded research briefs

Readers download a branded PDF or PowerPoint of the exact view they are looking at.

LIVE EXAMPLES

See it working

Live examples built from real scientific, government and historical data, with the method stated. Every number comes from the published source.
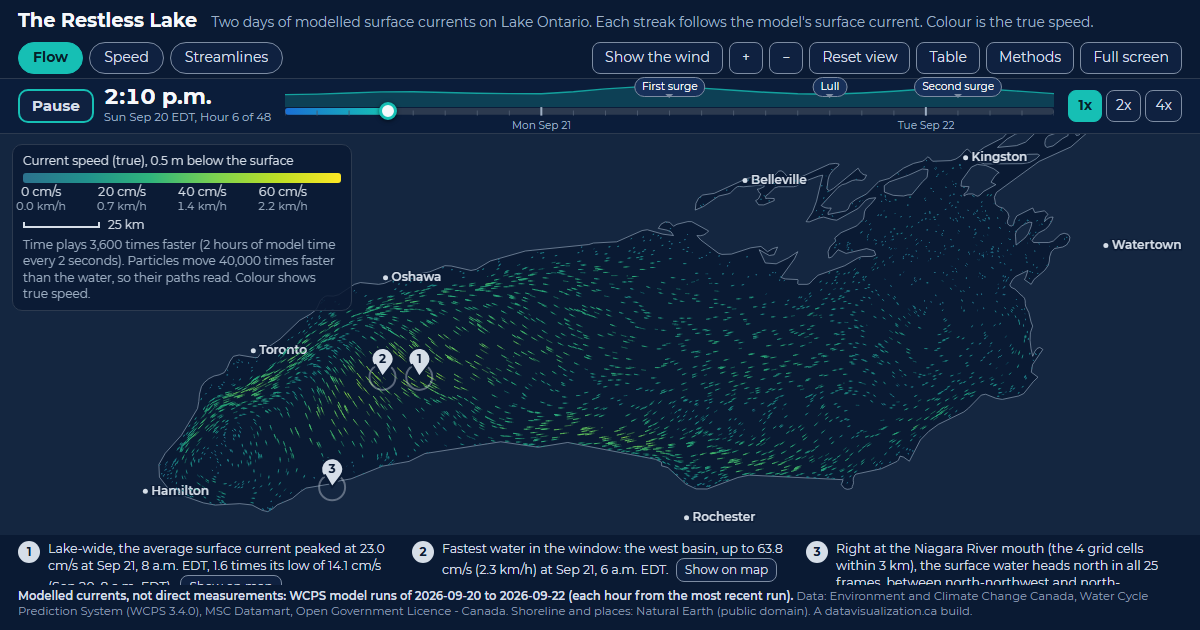
The Restless Lake: Lake Ontario filled with glowing streaks that follow the modelled surface current, coloured by speed.

RESEARCH - MODELLED DATA

The Restless Lake

Two days of modelled surface currents on Lake Ontario. Every streak follows the current; the west basin peaks at 63.8 cm/s.

See the example

Toronto Grid Pulse: every streetlight pole in Toronto as a glowing dot on the City's mapping, brightest downtown, with major roads labelled.

RESEARCH - LONG-TERM DATA

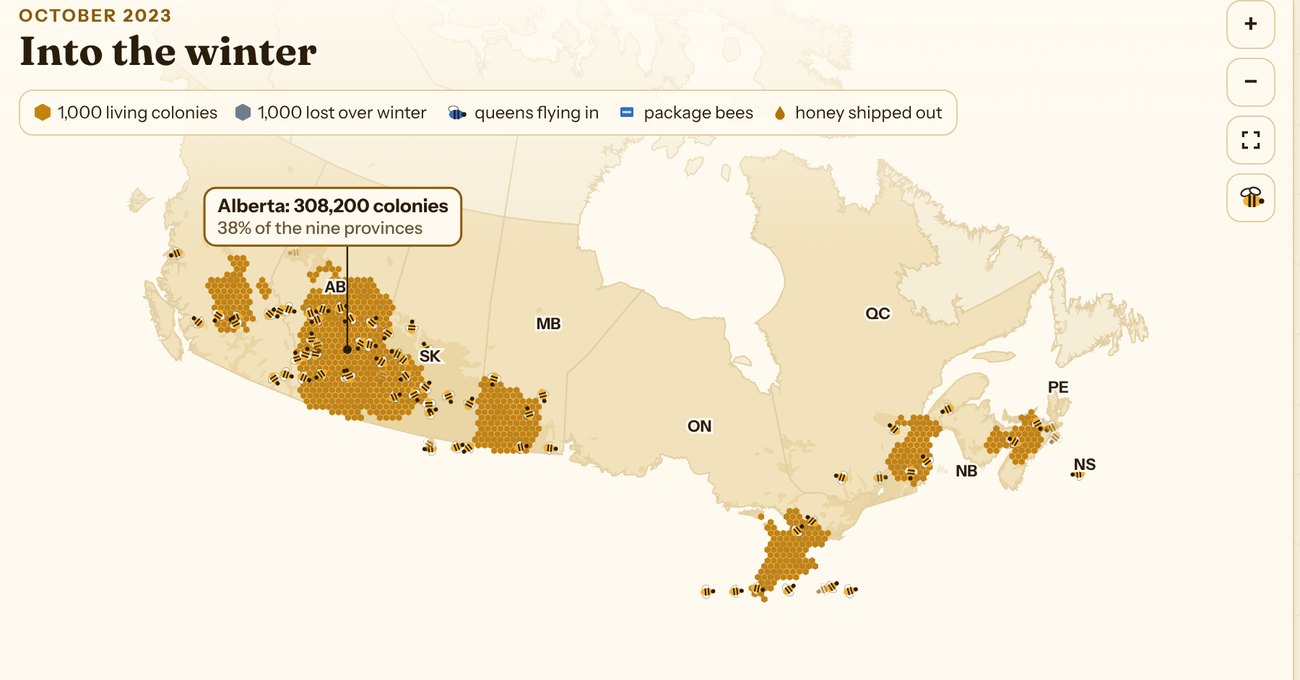
Canadian Honey Bee Explorer

854,653 colonies, a century of honey and every winter's losses since 2007, in four narrated stories with a map for each.

See the example

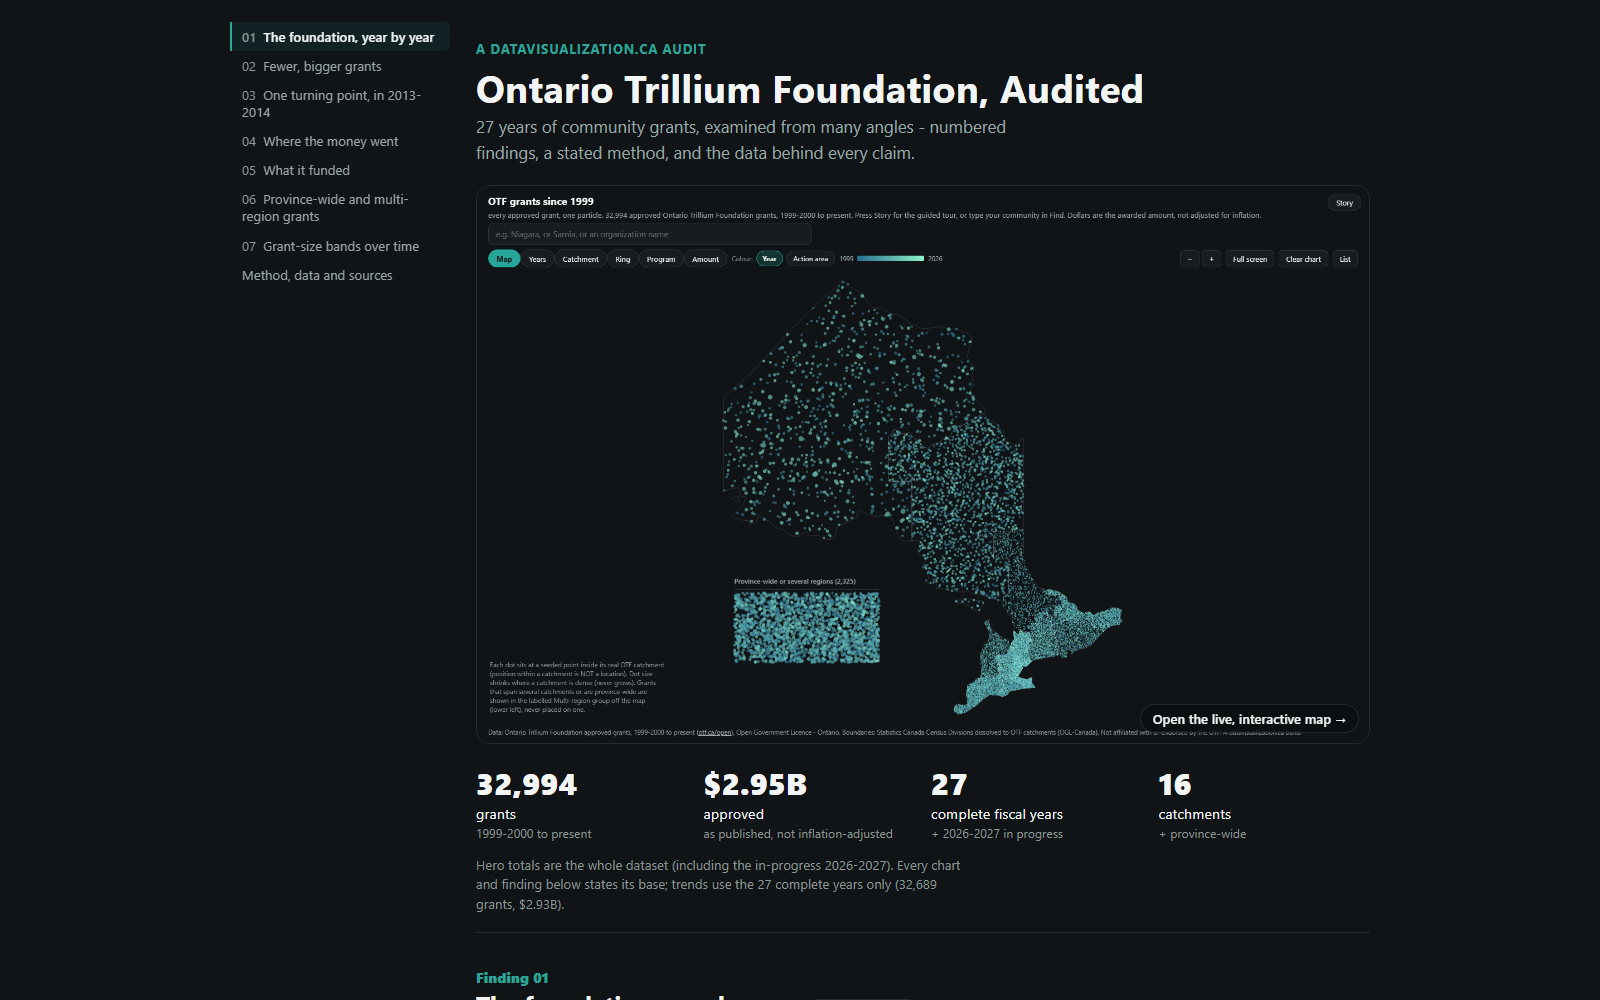
The audit page: the title Ontario Trillium Foundation, Audited, a map of Ontario made of one dot per grant, and four headline numbers: 32,994 grants, $2.95B approved, 27 complete fiscal years, 16 catchments.

RESEARCH - AUDIT AND METHOD

Ontario Trillium Foundation, Audited

27 years of grants examined from every angle: seven numbered findings, a stated method and an inflation-adjusted view.

See the example

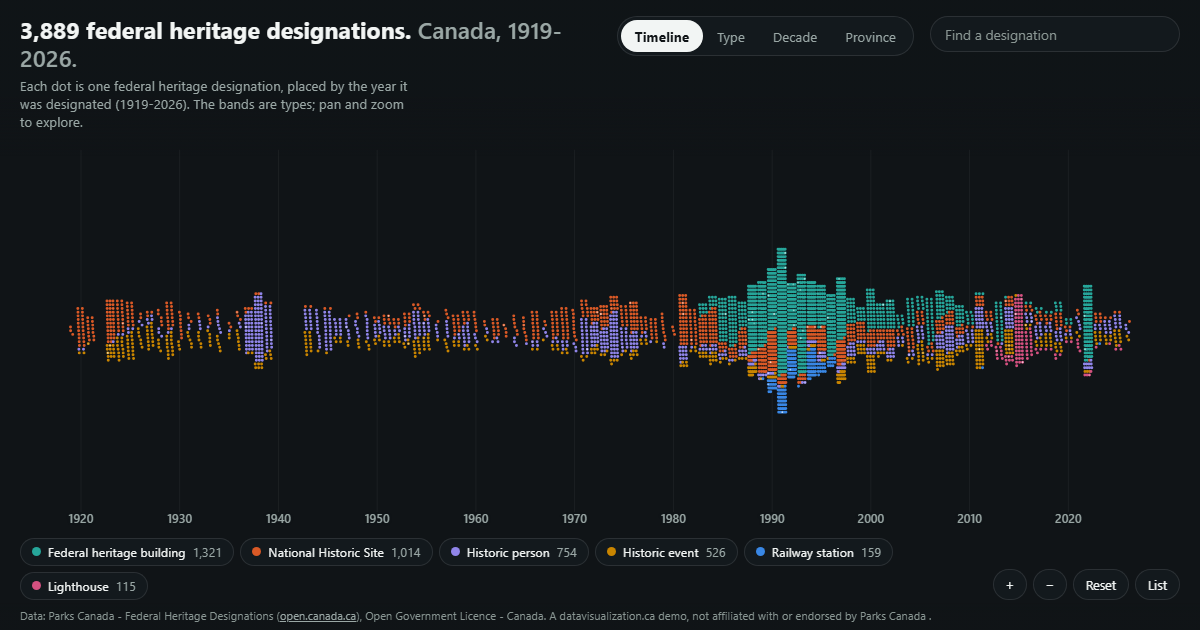
Federal heritage designations placed by year along a timeline.

RESEARCH - HISTORY

Canada's Heritage Designations

3,889 federal heritage designations, each placed by the year it was designated, 1919 to 2026.

See the example

YOUR DATA

Built from the data behind your work

If it fits in a spreadsheet, a database or a model output file, it can be visualized. We work from your files and keep a record of every step.

  • Survey microdata summaries
  • Field measurements
  • Model and simulation output
  • Census and Statistics Canada tables
  • Long-term monitoring series
  • Geospatial layers
  • Interview and coding summaries
  • Bibliometric data
  • Lab and sensor readings
  • Published open datasets

AODA / WCAG 2.1 AA

Accessible research, AODA ready

Ontario's AODA requires public sector organizations, including universities and colleges, to make their websites meet WCAG 2.0 Level AA. Every visualization we build meets WCAG 2.1 AA, a newer and stricter standard, so it can go on a university or project site without a retrofit.

Text table behind every chart

Every number can be read without the picture

Full keyboard access

Every control works without a mouse

Screen reader announcements

Changes are read out as people explore

Reduced motion respected

Animation can be paused or turned off

WCAG 2.1 AA on every build

WAYS TO WORK WITH US

Build it, licence it, or both

Every project is quoted after a discovery call, and we can work to a grant budget. Here is how research teams usually work with us.

Custom build

We design and build a visualization around your findings and your audience, ready to embed on a project or university site.

Licence

Use one of our ready-made visualizations with your own data and branding, on a monthly or yearly plan.

Build and licence

A custom build for publication, then a licence that keeps it hosted and refreshed as new data is collected.

HOW IT WORKS

From first call to publication

1

Discovery call

Tell us about the research and who needs to understand it. We suggest what the experience could look like.

2

Scope and quote

We review the data and method, confirm what it can honestly show, and send you a quote.

3

Build and review

You see a working draft early, and we refine it with your team.

4

Launch and update

It goes live with the publication or launch, and it can be updated as new data arrives.

Questions research teams ask us

Openly. Confidence intervals, margins of error and modelled versus measured data are labelled on the chart and explained in plain words, never hidden.
Yes. Interactive visualizations are a strong way to reach audiences beyond academia, and we can quote to fit a grant budget and timeline.
Your data stays yours. How the finished visualization is owned or licensed is agreed in the quote, before any work starts.
Yes. Every build meets WCAG 2.1 AA, with full keyboard access and a text version of every chart.
Every project is quoted. The price depends on the size and condition of your data, the number of views, and features like maps, tours or downloadable reports. See what affects pricing, or book a discovery call for a quote.

Bring your findings to a wider audience

Tell us about your research and the data behind it. We will show you what an interactive experience could look like and what it takes to build it.