Examples Municipalities Toronto budget

LIVE EXAMPLE - OPEN DATA

Where Toronto's $18.13 billion goes

Toronto publishes its operating budget as open data, program by program. Here the 2025 approved budget flows from City programs to what the money is spent on, and the money moves.

Gross operating expenditure, 2025 approved budget. The interactive opens on click; every flow is also in a table.

$18.13B

gross operating spending, 2025

15

program groups (the 14 largest + all others)

7

expense categories

92

program-to-category flows

What the data reveals

MOSTLY PEOPLE

44% is salaries and benefits

Salaries ($6.09B, 33.6%) and benefits ($1.91B, 10.5%) together come to $8.00B of the $18.13B.

BIGGEST SINGLE PROGRAM

Transit: $2.64B

The TTC's conventional service is 14.5% of gross spending. Next: Children's Services ($1.67B) and the Toronto Police Service ($1.48B).

GROSS, NOT NET

What is spent, before revenues

These are gross figures. The net, tax-supported budget the City reports is smaller, because revenues such as fees and transfers are not subtracted here.

NOTHING HIDDEN

Smaller programs, grouped

Every program outside the 14 largest is combined as Other programs: $4.11B, or 22.7% of the total. No dollars are dropped.

INTERACTIVE

How to explore it

Follow the money

Hover a stream to highlight it and see its exact dollar total.

Money in motion

Each moving dot is about $25.9M. With reduced motion on, the streams are drawn as still texture instead.

Every flow, as text

A table lists all 92 flows, largest first, with dollars and share.

Keyboard and screen reader

The table is a focusable region you can tab to and scroll. It is the full text equivalent of the diagram.

About the data

Source: City of Toronto Open Data, Operating Budget Program Summary by Expenditure Category, 2025 approved budget, published under the Open Government Licence - Toronto. Not affiliated with or endorsed by the City of Toronto.

  • Gross operating expenditure: $18,131,347,954.
  • Programs are shown as the 14 largest plus one Other programs group. Expense categories are the 6 largest plus Other spending.
  • Dollars are as published for 2025. Nothing is estimated.

Make your budget something residents can explore

Open data, budgets, development activity and community statistics, easy for residents and council to explore. Transparency becomes something people can actually use.

More examples

Map of Ontario made of dots, one for every Ontario Trillium Foundation grant since 1999, coloured by year. Southern Ontario is densest; 2,325 province-wide grants sit in a labelled group beside the map.

Ontario community grants since 1999

32,994 Ontario Trillium Foundation grants, one dot each, on the map of Ontario.

See the grants example

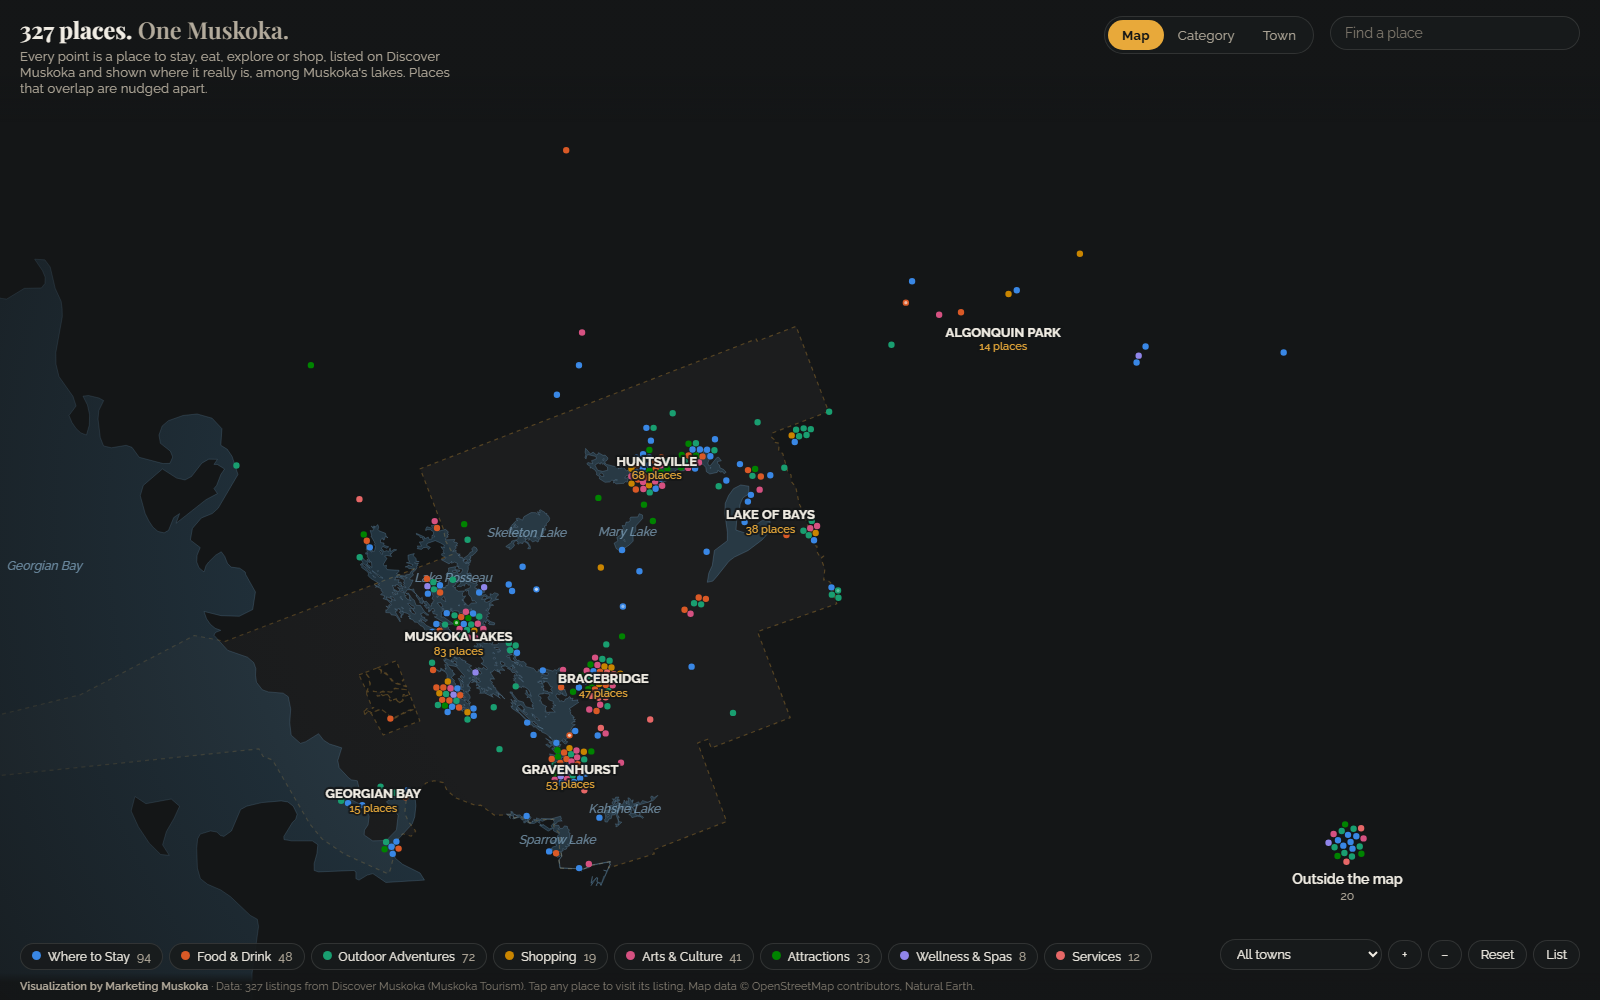
Map of Muskoka with coloured dots for tourism listings placed among the real lakes, grouped by town: Muskoka Lakes, Huntsville, Gravenhurst, Lake of Bays and more.

Muskoka tourism

Muskoka's tourism listings on a real map of its lakes, each placed by its own listing's coordinates.

See the tourism example

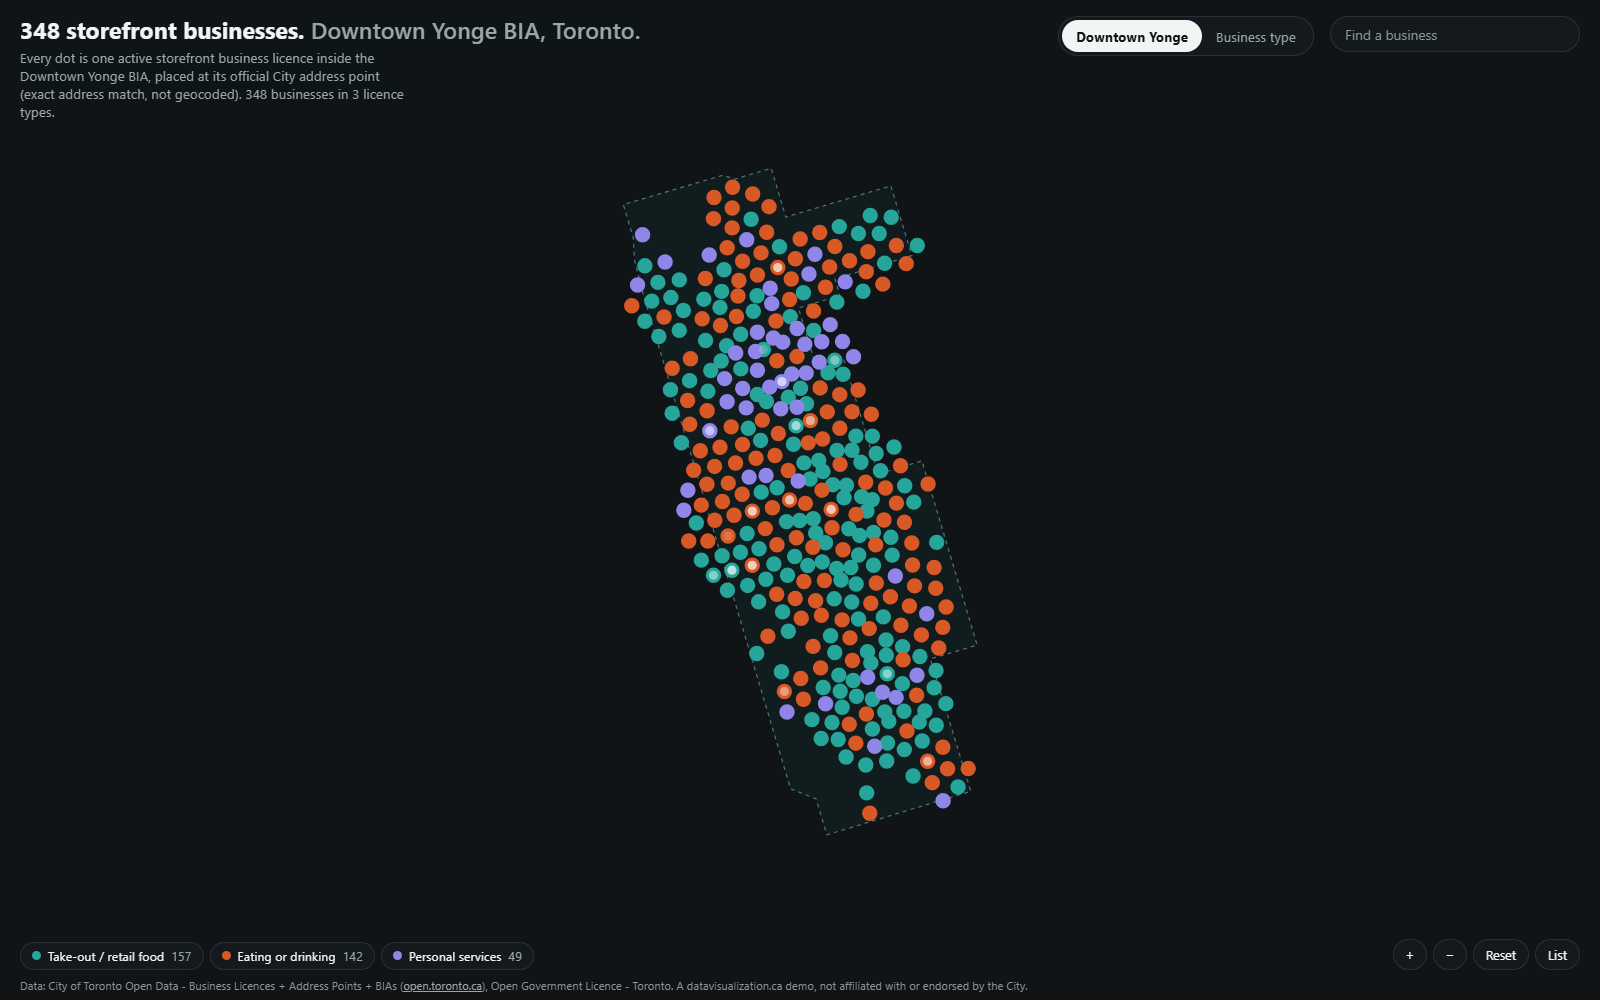
Map of the Downtown Yonge BIA boundary filled with 348 dots, one per storefront business, coloured by licence type.

Business Improvement Areas

348 storefront businesses in Toronto's Downtown Yonge BIA, each placed at its official City address.

See the BIA example