Home Industries Municipalities & Regional Governments

INDUSTRIES

Data Visualization for Municipalities and Regional Governments

We turn budgets, development applications and traffic counts into interactive maps and charts that residents and council can explore on their own. No login, no training.

THE CHALLENGE

Open data only helps when people can read it

Most municipalities publish more data than ever. It sits in open data portals, budget books and council reports, as spreadsheets and PDFs. Residents who want to know what is being built on their street, or where their tax dollars go, give up long before they find an answer, and staff answer the same questions again and again.

An interactive visualization puts the answer one click away, on your own website, in a form anyone can use.

TODAY

  • Budget books and council reports as long PDFs
  • Spreadsheets sitting in an open data portal
  • Staff answering the same questions again and again

WITH AN INTERACTIVE VISUALIZATION

  • One interactive map or chart on your own website
  • Residents find their own answer in a click
  • Open to everyone, WCAG 2.1 AA

Questions residents and council ask

WHAT WE BUILD

What we build for municipalities

Budget explorers

Show where every dollar goes, program by program, with exact figures and a text table behind every chart.

Development and planning maps

Every application on its parcel, with its status, its walking distance to transit and a link to the official record.

Traffic and mobility

Measured counts and speeds animated across a typical day, so the rush hour becomes something people can see.

Downtown and business profiles

Business licences and BIA boundaries joined into a living map of a district, searchable by name and type.

Ward and neighbourhood comparisons

Shaded maps and side-by-side charts that compare wards and neighbourhoods on the measures council tracks.

Instant branded reports

Let staff or residents download a branded PDF or PowerPoint of the exact view they are looking at.

LIVE EXAMPLES

See it working

Live examples built from real municipal open data. Every number on these pages comes from the published source.
MUNICIPAL - DEVELOPMENT

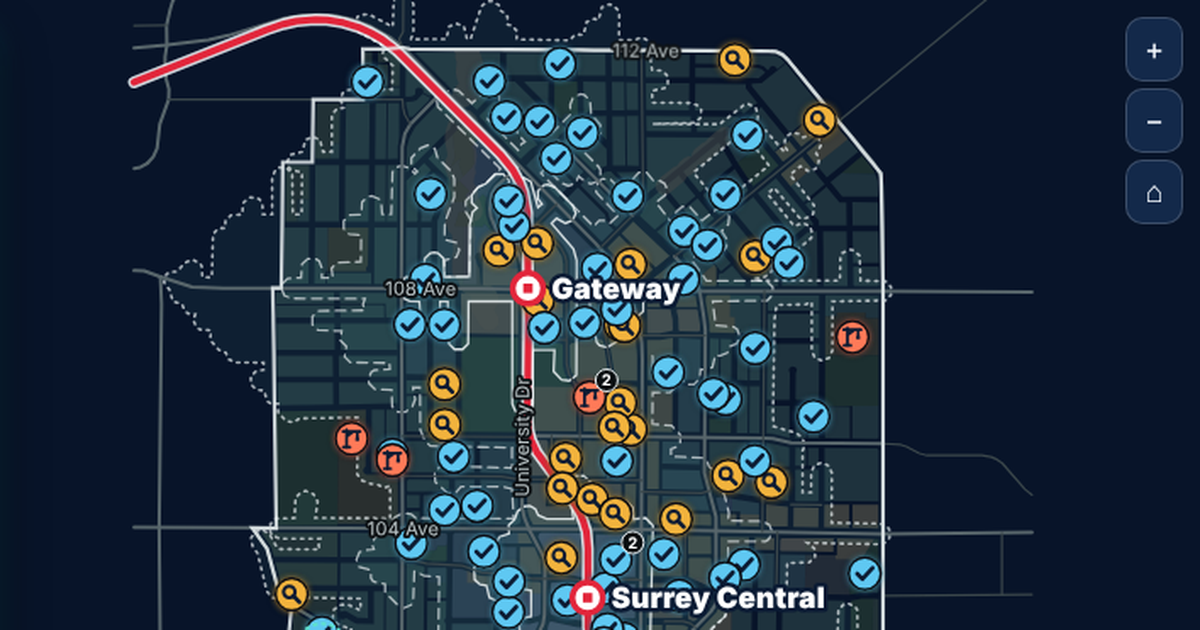
Surrey City Centre

950 development applications on their parcels, with real walking times to three SkyTrain stations.

See the example

Toronto Grid Pulse: every streetlight pole in Toronto as a glowing dot on the City's mapping, brightest downtown, with major roads labelled.

MUNICIPAL - INFRASTRUCTURE

Toronto Grid Pulse

213,618 streetlight poles, 4,439 active development sites, City EV chargers and street trees, mapped street by street.

See the example

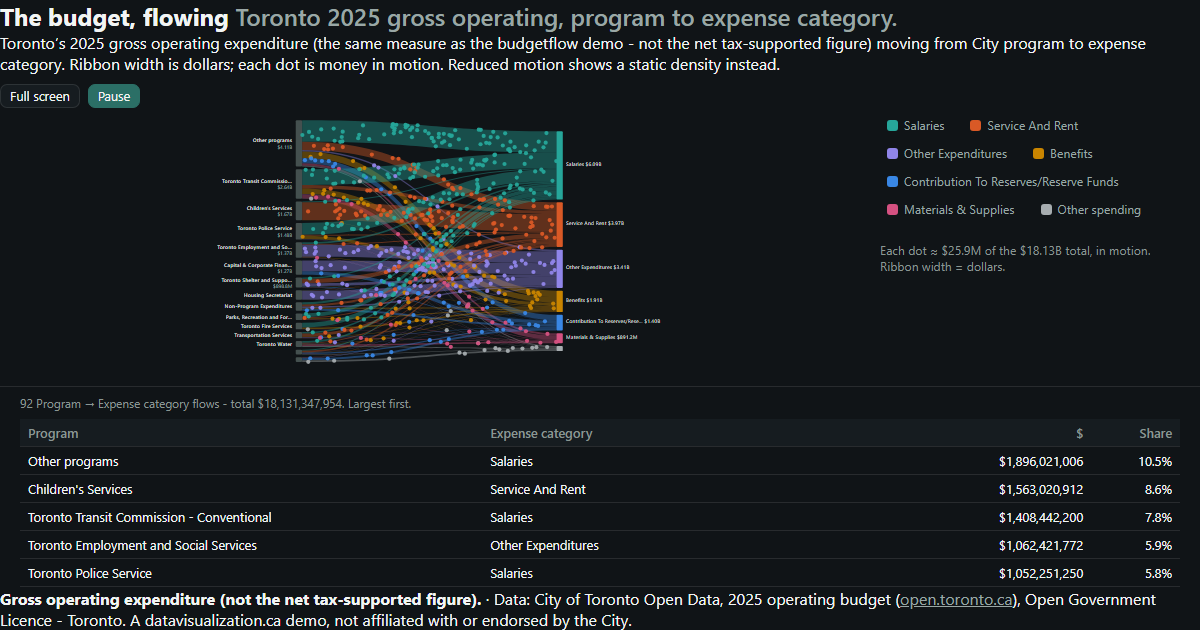
Toronto's 2025 operating budget flowing from programs to expense categories.

MUNICIPAL - BUDGET

Toronto Budget

$18.13 billion in 2025 operating spending, flowing from City programs to what the money buys.

See the example

Downtown Pulse: downtown Toronto streets with glowing counted road segments and small dots travelling along them, coloured by measured speed.

MUNICIPAL - MOBILITY

Downtown Pulse

A typical weekday of measured traffic in downtown Toronto, built from 229 City counts.

See the example

YOUR DATA

Built from data you already publish

If it fits in a spreadsheet, it can be visualized. Most of these are already in your open data portal, so we can often start from data you have already released. No clean dataset? We can build one from public sources.

  • Operating and capital budgets
  • Development applications
  • Building permits
  • Business licences
  • Traffic and cycling counts
  • 311 service requests
  • Zoning and property layers
  • Ward and census profiles
  • Parks and facilities
  • Transit stops and routes

AODA / WCAG 2.1 AA

Ready for AODA from day one

Ontario's AODA requires public sector organizations to make their websites meet WCAG 2.0 Level AA. Every visualization we build meets WCAG 2.1 AA, a newer and stricter standard, so it can go on a municipal website without an accessibility retrofit.

Text table behind every chart

Every number can be read without the picture

Full keyboard access

Every control works without a mouse

Screen reader announcements

Changes are read out as people explore

Reduced motion respected

Animation can be paused or turned off

WCAG 2.1 AA on every build

WAYS TO WORK WITH US

Build it, licence it, or both

Every project is quoted after a discovery call. Here is how most clients work with us.

Custom build

We design and build a visualization around your data and your audience, ready to embed on your website.

Licence

Use one of our ready-made visualizations with your own data and branding, on a monthly or yearly plan.

Build and licence

A custom build to start, then a licence that keeps it hosted, supported and refreshed as your data changes.

HOW IT WORKS

From first call to launch

1

Discovery call

Tell us who needs to understand your data and what you have. We suggest what the experience could look like.

2

Scope and quote

We review the data, confirm what it can honestly show, and send you a quote.

3

Build and review

You see a working draft early, and we refine it with you.

4

Launch and update

It goes live on your website, and it can be refreshed as new data comes in.

Frequently asked questions

Yes. Each visualization is a single web page that embeds on any website that allows an embed, including WordPress. It can also live on its own page and be shared with a single link.
No. Most projects start from what is already in your open data portal or a spreadsheet export. We clean, check and document it, and we never fill gaps with made-up numbers.
Yes. Every build meets WCAG 2.1 AA, which goes beyond the WCAG 2.0 Level AA that AODA requires. That includes full keyboard access and a text version of every chart.
Yes. We set each build up so new data can be added and the visualization refreshed, whether you update it yourself or have us do it.
Every project is quoted. The price depends on the size and condition of the data, the number of views, and features like maps or downloadable reports. See what affects pricing, or book a discovery call for a quote.

Make your open data something residents use

Tell us what residents keep asking and what data you have. We will show you what an interactive experience could look like and what it takes to build it.