Home Industries Marketing & Advertising Agencies

INDUSTRIES

Data Visualization for Marketing and Advertising Agencies

Your client has the data. You have the relationship. We build the interactive maps and charts that make it easy to understand, working alongside your team and, when you want, behind your brand.

THE CHALLENGE

Your clients have data. Few can show it.

Clients bring agencies annual reports, research, campaign results and open data they want people to notice. Turning that into an interactive map or data story takes design, data and accessibility skills that most agencies do not keep on staff for one project.

We work alongside your team as that specialist, so you can say yes to the brief and deliver something your client's audience will actually explore.

TODAY

  • Campaign and report results stuck in slides and PDFs
  • Hiring data visualization talent for a single brief
  • Static charts that look like every other pitch

WITH AN INTERACTIVE VISUALIZATION

  • Interactive experiences your clients can explore
  • A specialist team behind your brand, when you need it
  • Ready for any client site, WCAG 2.1 AA

Questions your clients ask

HOW IT WORKS

How a partnership works

Four steps from the first conversation to launch, and who leads each one.

You your agency Us DataVisualization.ca Together both teams

01

You

You bring the opportunity

A client with a dataset, a report or a story that needs to reach the public.

02

Together

We scope it with you

We look at the data together and agree what the experience should do and what it takes to build.

03

We build, you present

We build, you present

Design and build happen with your team in the loop. White-label delivery is available.

04

Together

It lives on your client's site

Every experience is built for the web and embeds on any website, including WordPress.

WHAT WE BUILD

What we build for agencies and their clients

White-label client dashboards

Interactive dashboards in your client's brand, delivered under your agency's name.

Campaign result stories

Campaign reach and results as an animated story your client can share with their board.

Audience and market maps

Where your client's customers are, by neighbourhood, region or store.

Pitch and proposal prototypes

An interactive prototype built from public data to help you win the pitch.

Annual and impact report pages

A client's annual report numbers turned into a page people actually explore.

Branded client reports

A branded PDF or PowerPoint of the exact view, ready for the client meeting.

WHITE-LABEL

Behind your brand, when you want

Add data visualization to your client offering without hiring in-house. We work alongside your team and can operate behind your brand.
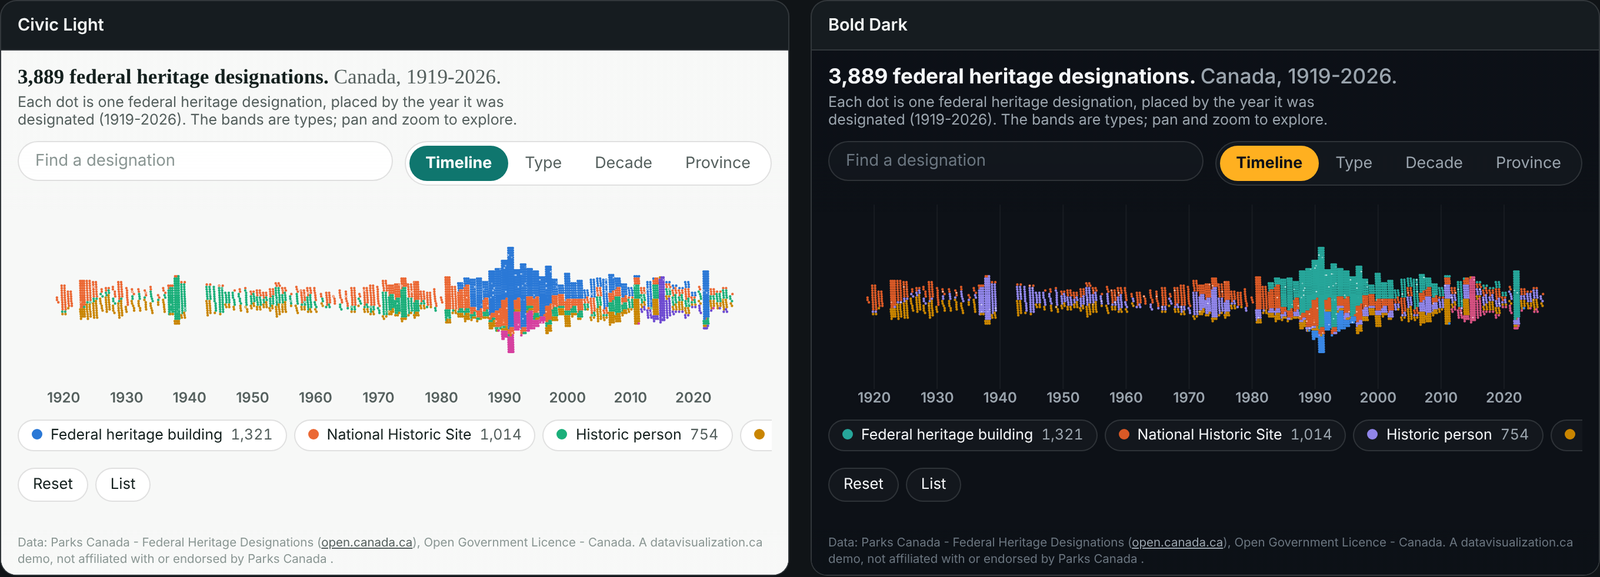
The same visualization of 3,889 federal heritage designations shown side by side in two brand themes: Civic Light, a light theme with teal accents, and Bold Dark, a dark theme with yellow accents. The data, layout and controls are identical.

One engine, two brands: the same 3,889 Parks Canada heritage designations in two example client themes. Only the theme changes; the data, interactions and accessibility stay the same. Data: Parks Canada, Open Government Licence - Canada.

LIVE EXAMPLES

See it working

Live examples built from real public data. Any of them can be rebuilt in your client's brand, and every number comes from the published source.
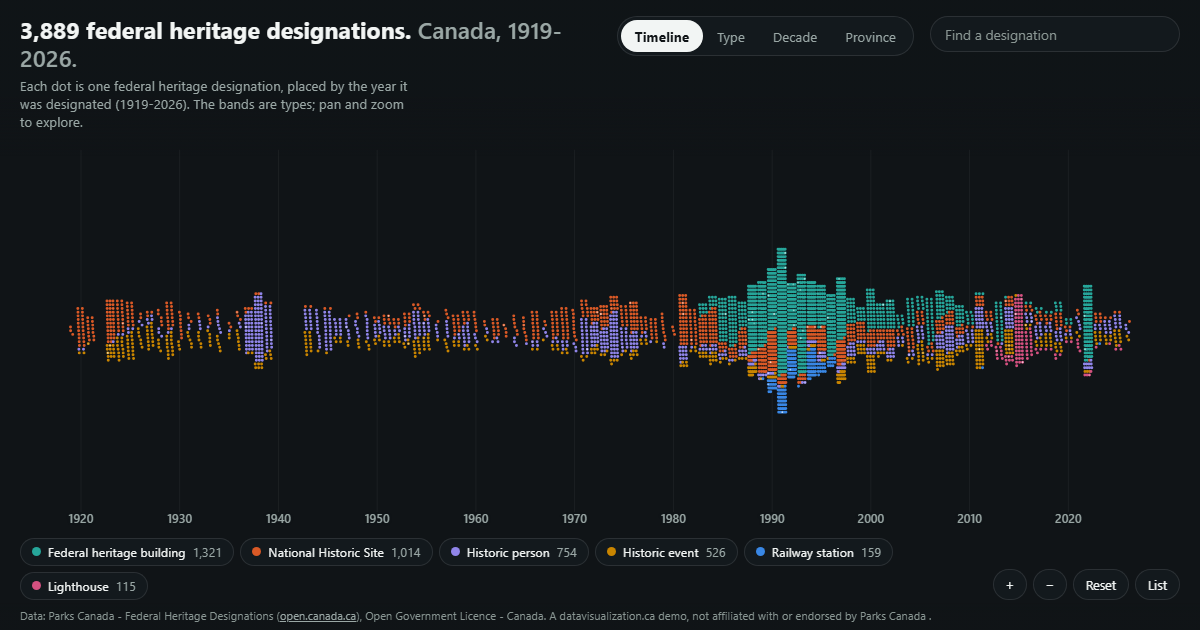
Federal heritage designations placed by year along a timeline.

WHITE LABEL - ANY BRAND

Canada's Heritage Designations

3,889 federal heritage designations, each placed by the year it was designated, 1919 to 2026.

See the example

Toronto Grid Pulse: every streetlight pole in Toronto as a glowing dot on the City's mapping, brightest downtown, with major roads labelled.

NONPROFIT - IMPACT

Ontario Community Grants

Every Ontario Trillium Foundation grant since 1999: 32,994 grants and $2.95 billion, one dot each.

See the example

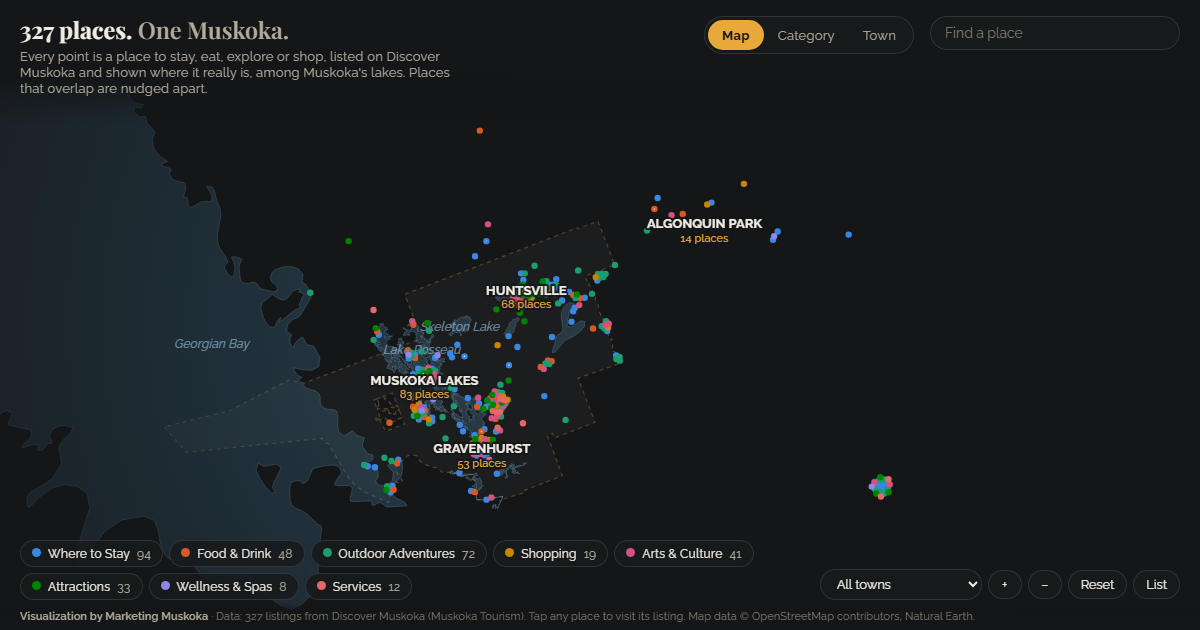
Muskoka's tourism listings as dots among the region's real lakes.

TOURISM - DESTINATION

Muskoka Tourism

327 tourism listings among Muskoka's real lakes, explored by category and by town.

See the example

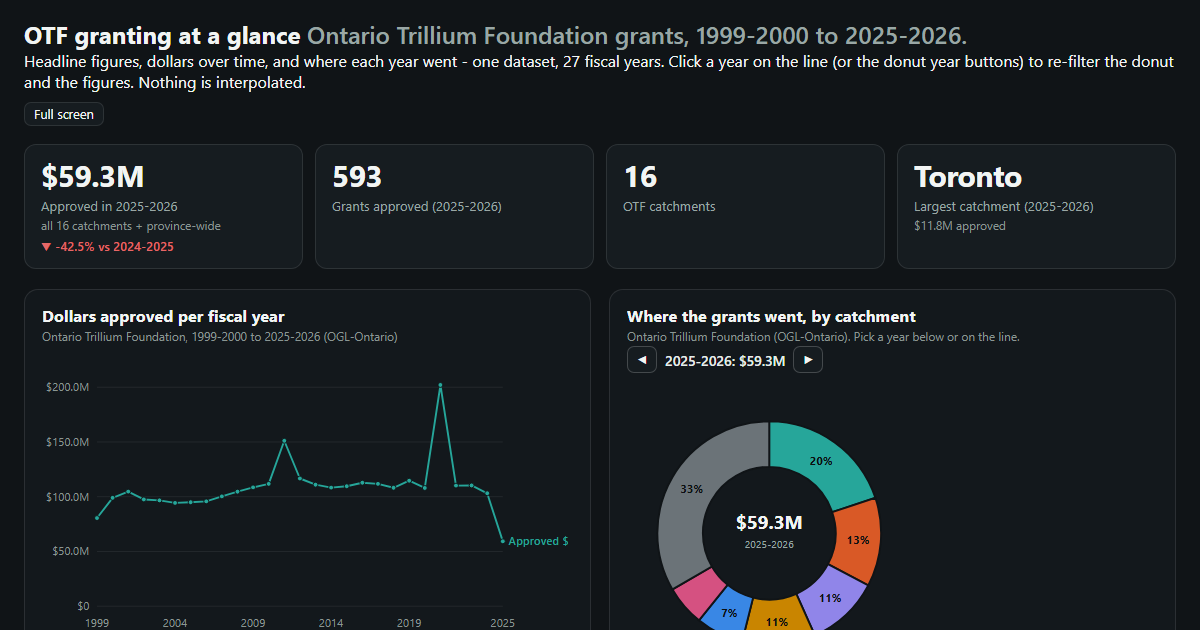
A dashboard of Ontario Trillium Foundation granting with headline figures, a line chart and a donut chart.

DASHBOARD - REPORTING

A Grants Dashboard

Headline figures, dollars over time and where the latest year went, from one open grants dataset.

See the example

What you can offer clients

Everything we build for our own clients is available to yours. Each card links to a live example or the details behind it.

Interactive data experiences

Custom-built web experiences where your data moves, responds and reorganizes as visitors click.

See the grants example

Map data visualization

When location matters, we plot the data geographically so visitors can see where activity is concentrated and how regions compare.

See the tourism map

Dataset creation from public sources

No clean dataset? We can build one by collecting public websites, directories and listings, then structuring the results.

See how we built one

Data storytelling

Each experience is designed around the questions the audience is actually asking, from the big picture down to the details.

Try the guided story

Accessible (WCAG 2.1 AA) visualizations

Full keyboard access, screen reader announcements and a text view of every record.

How we meet WCAG 2.1 AA

Embeddable on any site

Built for the web: it works on desktop and mobile, and it can be shared with a single link.

See all examples

YOUR DATA

Built from data your clients already have

If it fits in a spreadsheet, it can be visualized. Most clients already hold what we need, and where they do not, we can build a dataset from public sources.

  • Campaign and media results
  • Website and social analytics
  • Customer and member lists
  • Sales by region or store
  • Survey and research results
  • Annual and impact report figures
  • Grant and funding records
  • Locations and addresses
  • Census and market profiles
  • Public open data

AODA / WCAG 2.1 AA

Accessible in every client brand

Under Ontario's AODA, public sector organizations and businesses with 50 or more employees must make their public websites meet WCAG 2.0 Level AA. Every visualization we build meets WCAG 2.1 AA, a newer and stricter standard, whatever brand it wears, so it can go on your client's site without an accessibility retrofit.

Text table behind every chart

Every number can be read without the picture

Full keyboard access

Every control works without a mouse

Screen reader announcements

Changes are read out as people explore

Reduced motion respected

Animation can be paused or turned off

WCAG 2.1 AA on every build

WAYS TO WORK WITH US

Build, licence, or both

Every project is quoted after a discovery call. Here is how agencies usually work with us.

Custom build

We design and build a visualization around your client's data and audience, in their brand, ready to embed on their site.

Licence

Offer one of our ready-made visualizations with your client's data and branding, on a monthly or yearly plan.

Build and licence

A custom build to start, then a licence that keeps it hosted, supported and refreshed for your client.

Questions agencies ask us

Yes. White-label delivery is available. We can work behind your brand, and your client only deals with us directly if you want them to.
You do. You bring the opportunity and present the work; we scope it with you and build it with your team in the loop.
Yes. Colours, type and logo are a theme on top of the same engine, so the data, interactions and accessibility stay the same whatever brand it wears.
Yes. Every experience is built for the web and embeds on almost any website, including WordPress, and it can be shared with one link.
Every project is quoted. The price depends on the size and condition of your data, the number of views, and features like maps, tours or downloadable reports. See what affects pricing, or book a discovery call for a quote.

Add data visualization to your client offering

Tell us about your client and their data. We will show you what an interactive experience could look like and what it takes to build it.