
Home / Examples
Data Visualization Examples
Live, interactive visualizations built from real, credited Canadian data: community grants, tourism, a city budget, a business district and national heritage. Each one works with a keyboard and a screen reader, and has a text view of every record.
Browse by sector
AUDIT - NONPROFITS & FUNDERS
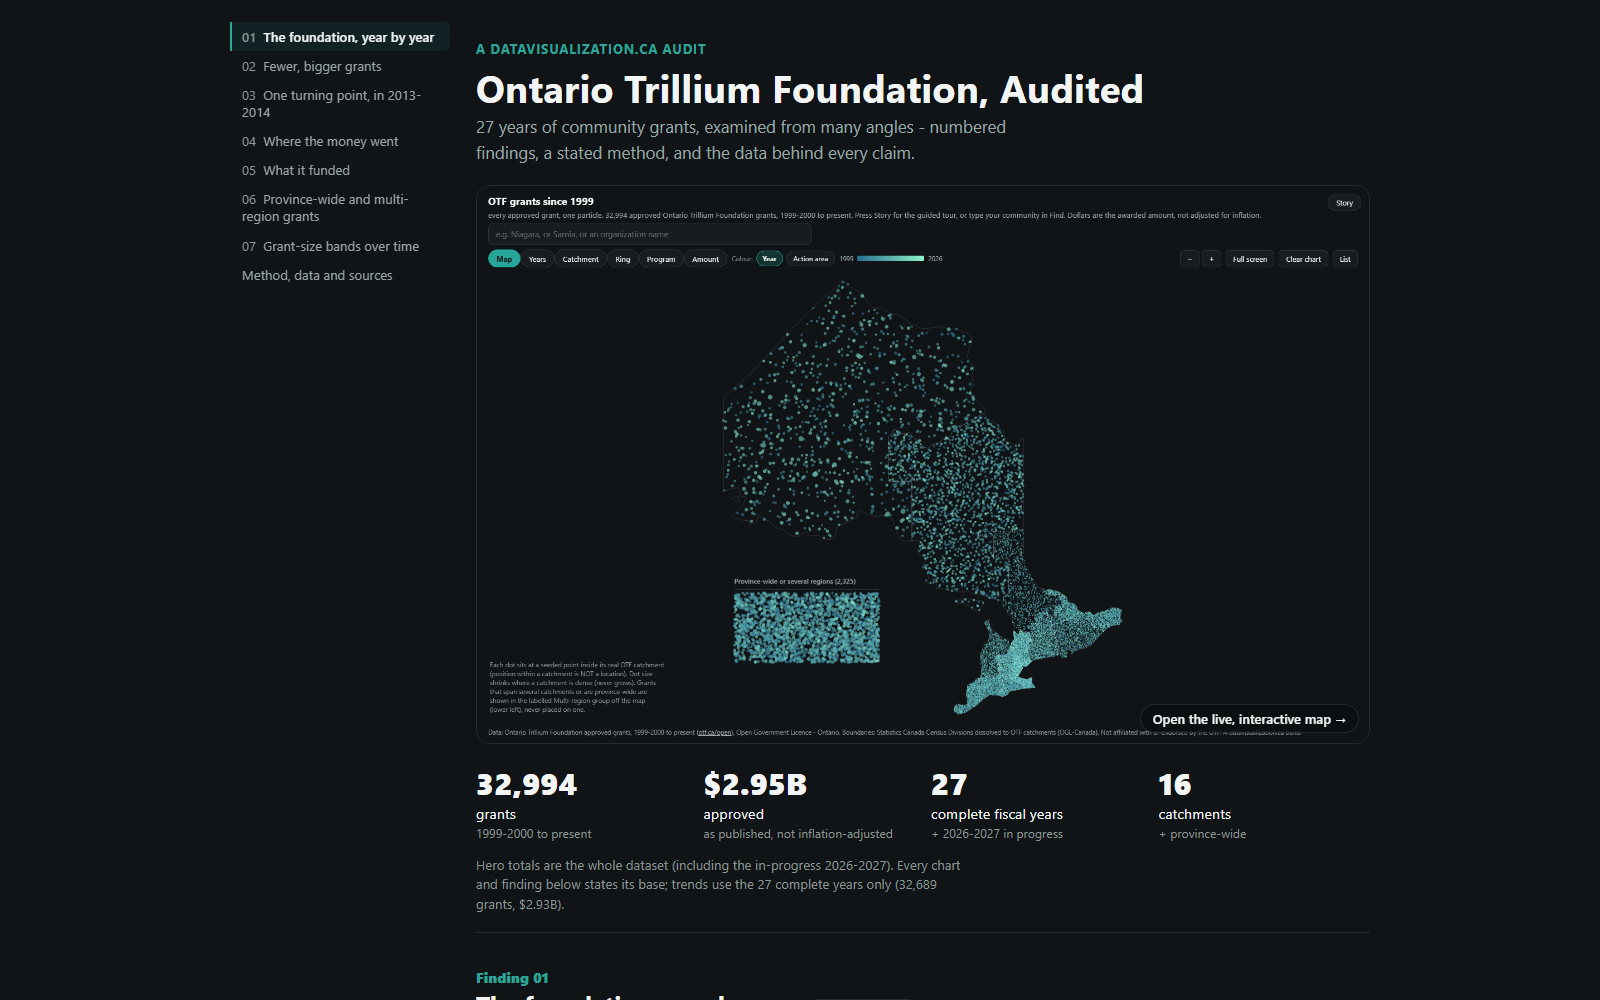
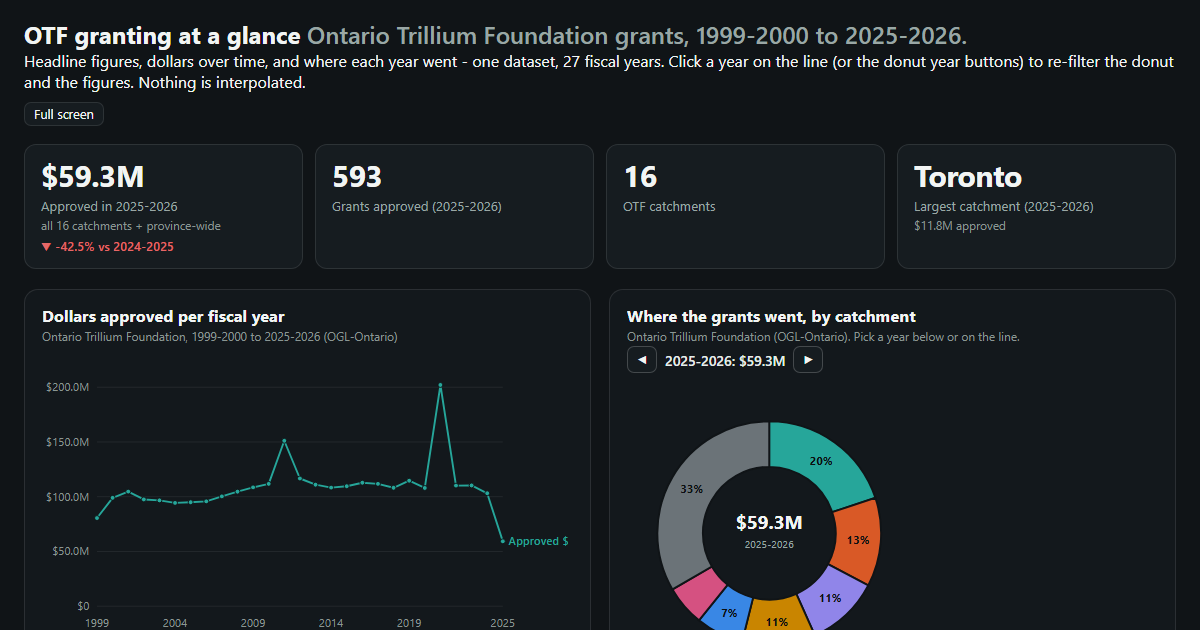
Ontario Trillium Foundation, Audited
27 years of OTF grants examined from every angle: seven numbered findings, a stated method and an inflation-adjusted view. Every chart has its numbers as text.
Read the audit
LIVE DEMO - RESEARCH & HERITAGE
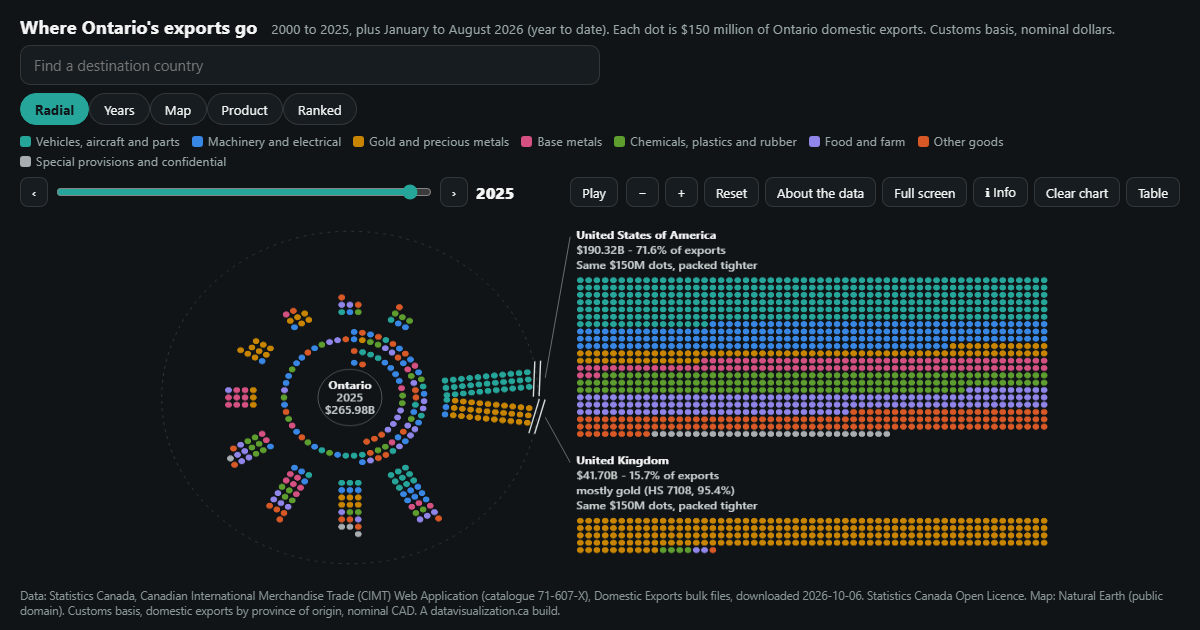
Where Ontario's exports go
Ontario's domestic exports to 216 destinations since 2000, one dot per $150 million. The US share fell from 93.2% to 71.6% as gold surged.
See the example
LIVE DEMO - MUNICIPALITIES
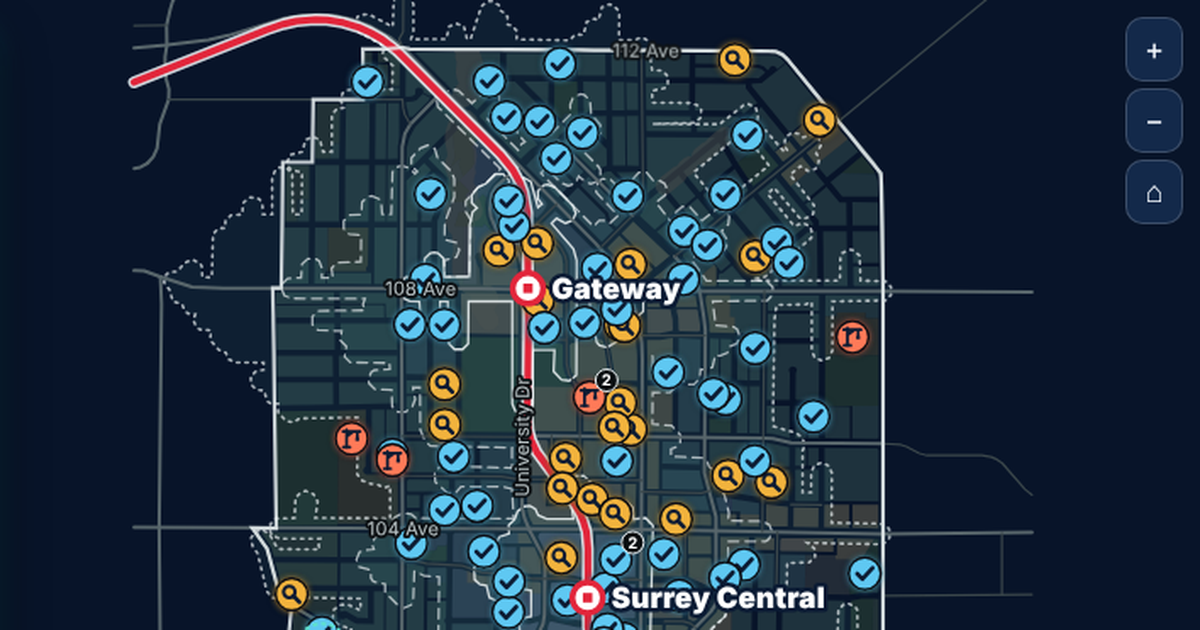
Surrey City Centre development map
950 development applications in Surrey City Centre on a real map, with walking times to SkyTrain. 74 of the 115 active ones are within a 10 minute walk.
See the example
LIVE DEMO - MUNICIPALITIES
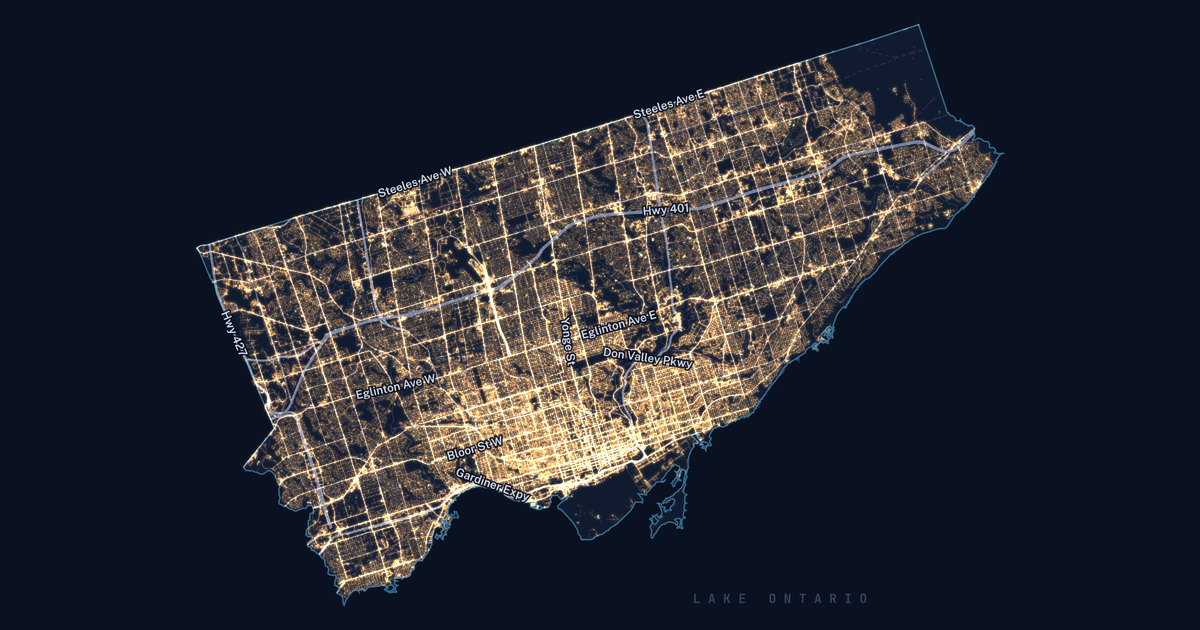
Toronto Grid Pulse
213,618 streetlight poles, 4,439 active development sites, 82 City-run chargers and 688,335 street trees on one real map of Toronto, with a narrated tour for each.
See the example
LIVE DEMO - AGRICULTURE
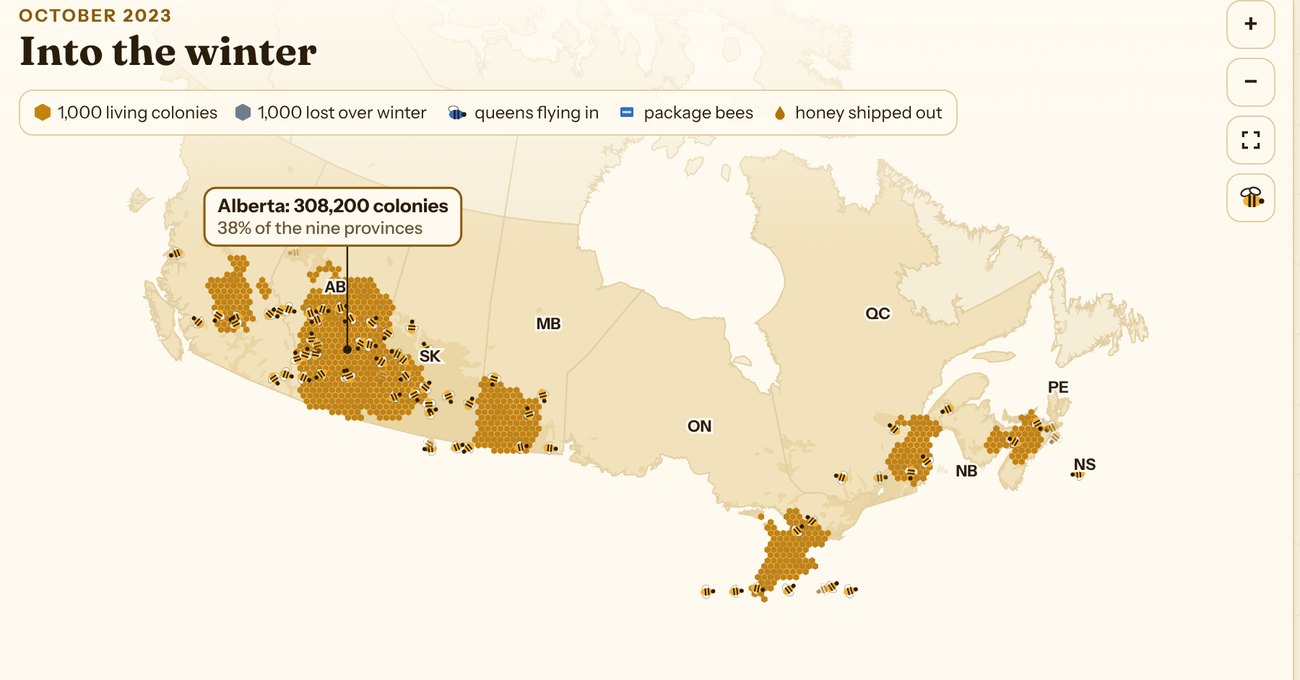
Canadian Honey Bee Explorer
854,653 colonies, a century of honey and every winter's losses since 2007, in four narrated stories with a map for each.
See the example
LIVE DEMO - MUNICIPALITIES
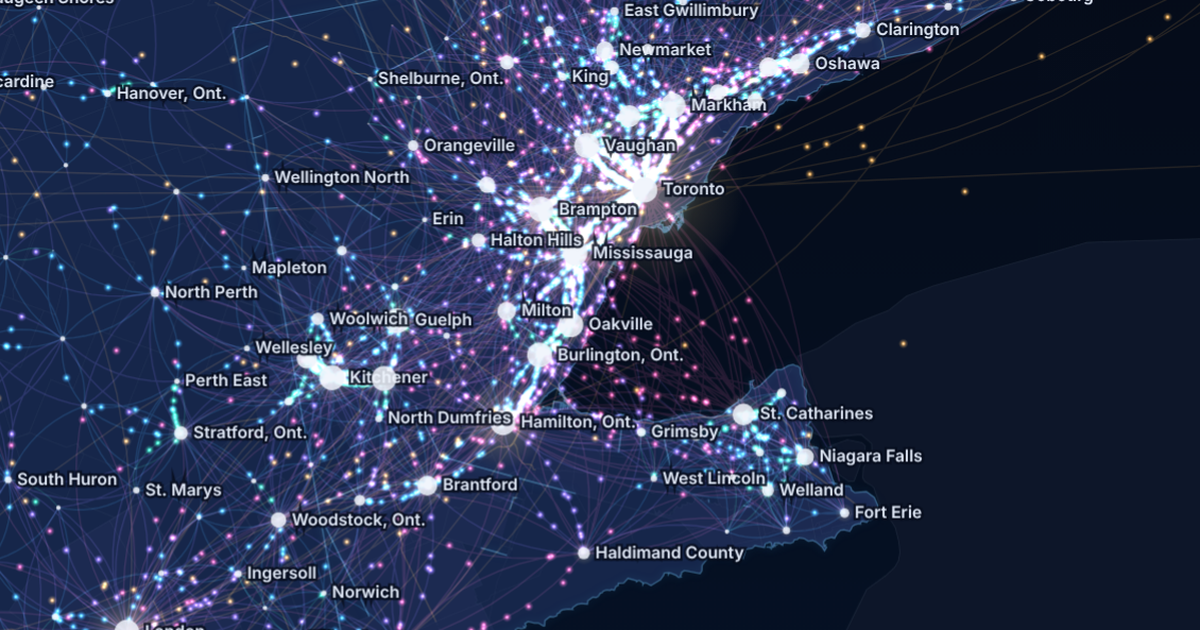
Canada Commutes
Every town-to-town commute in the 2021 Census on one animated map of Canada: 4,287,965 people crossing a town line to work, with four narrated tours and live traffic cameras.
See the example
LIVE DEMO - NONPROFITS & FUNDERS
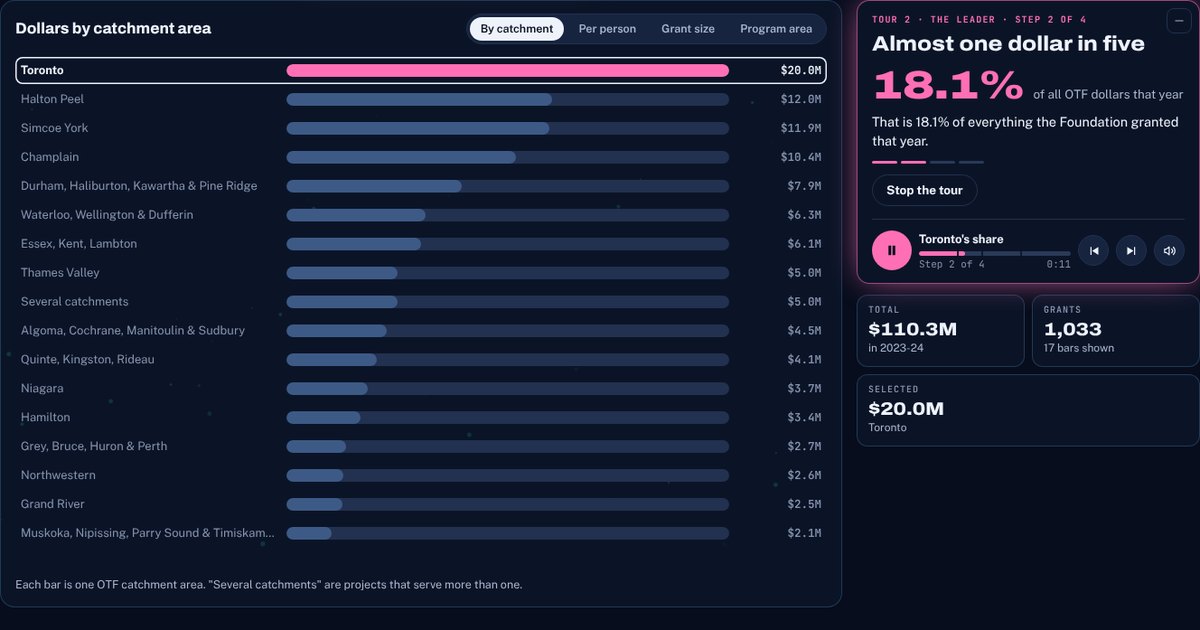
Where Ontario's grants went
One year of Ontario Trillium Foundation grants, $110.3M, in four narrated stories: where it went, Toronto's share, grant sizes and who gets the most per person.
See the example
LIVE DEMO - TOURISM
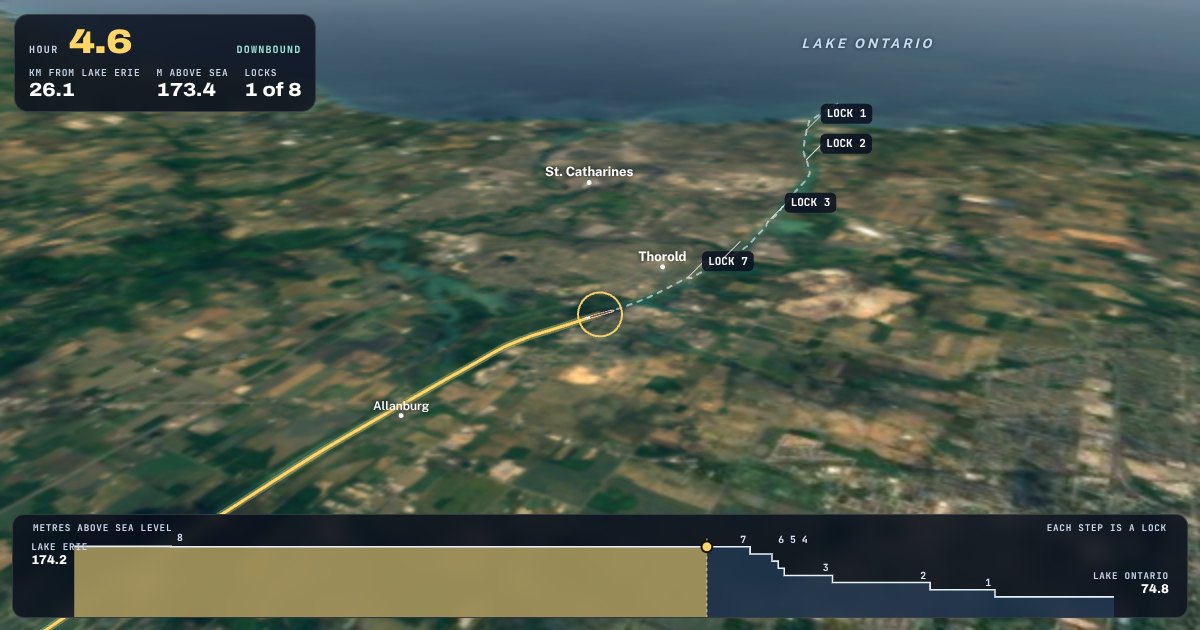
Down the Escarpment
A freighter's trip through the 8 Welland Canal locks on a 3D map, 99.5 m down the Niagara Escarpment, with four narrated tours and 67 seasons of traffic.
See the example
LIVE DEMO - ANNUAL REPORTS
Muskoka Tourism's 2026 Annual Plan
A 23 page annual plan PDF as one branded page: 14 chapters, four narrated tours, a narrated walkthrough and a branded PDF of any chapter.
See the example
LIVE DEMO - RESEARCH & ENVIRONMENT
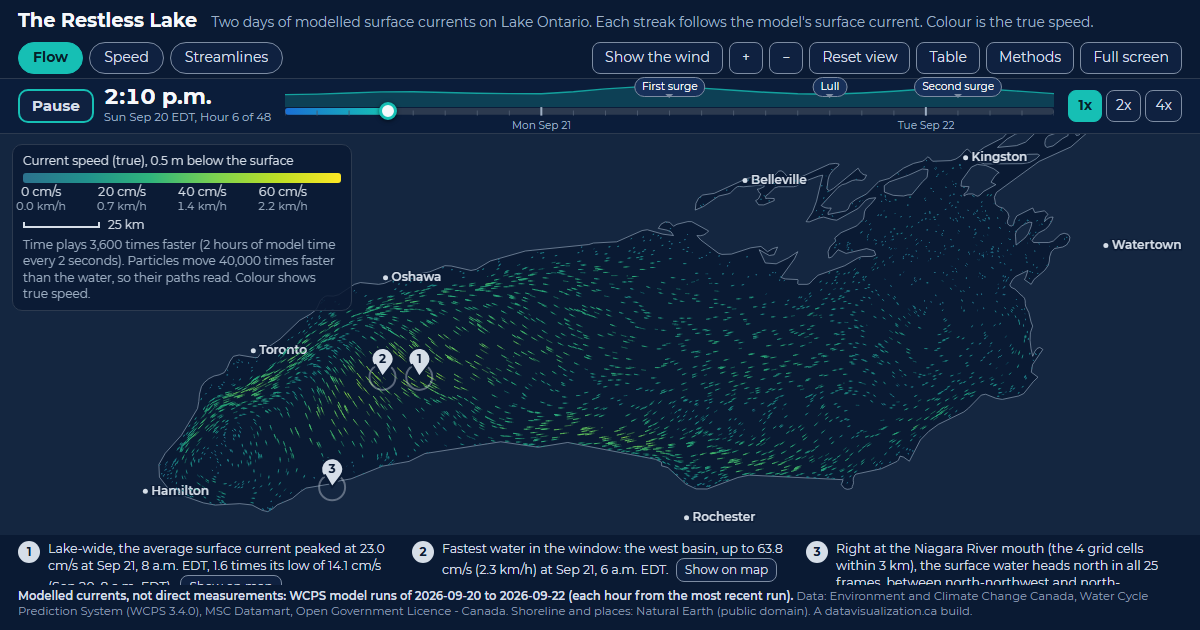
The Restless Lake
Two days of modelled surface currents on Lake Ontario. Every streak follows the current; the west basin peaks at 63.8 cm/s.
See the example
LIVE DEMO - RESEARCH & ENVIRONMENT
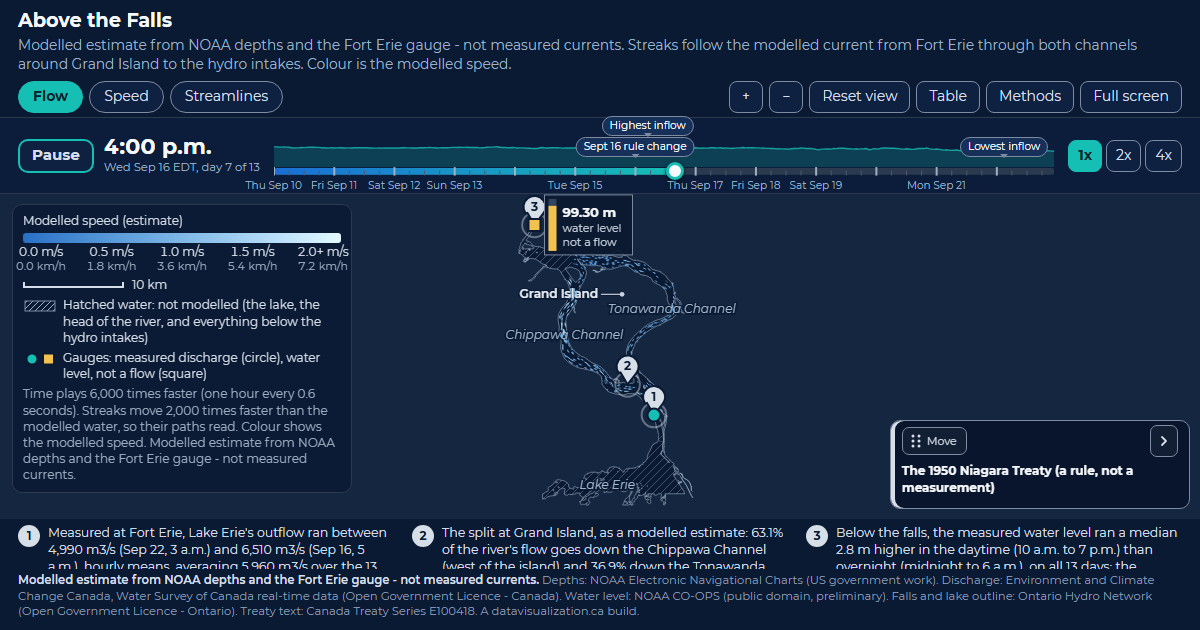
Above the Falls
Lake Erie's water around Grand Island to the hydro intakes. Modelled, 63.1% takes the Chippawa Channel; the published figure is about 60%.
See the example
LIVE DEMO - RESEARCH & ENVIRONMENT
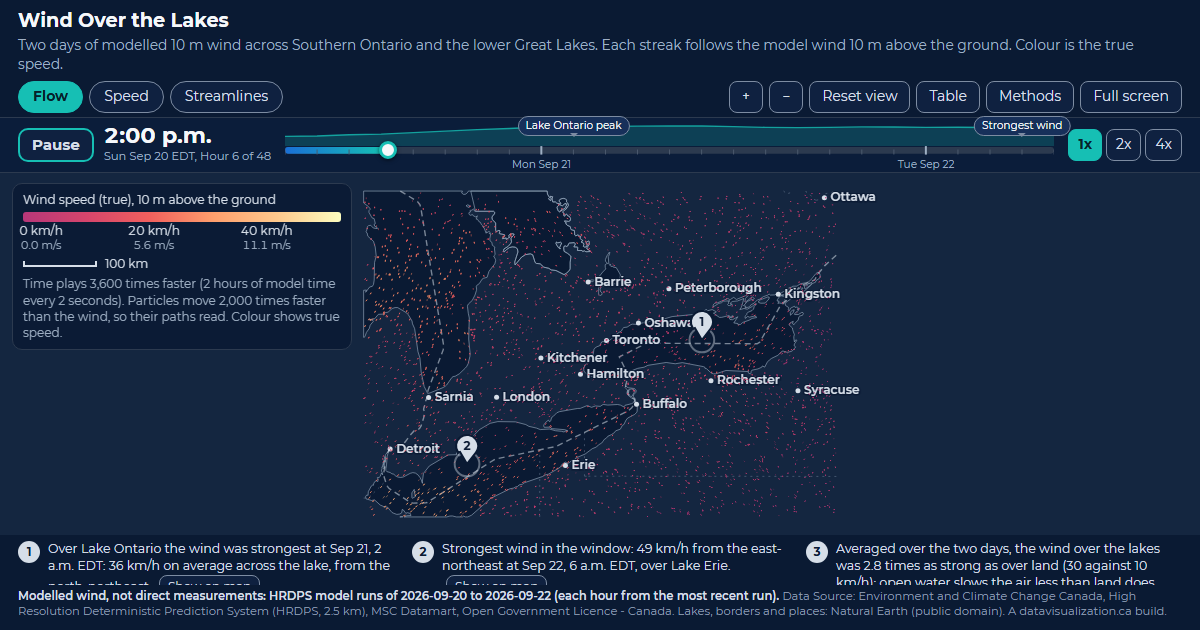
Wind Over the Lakes
Two days of modelled wind over Southern Ontario and the lower Great Lakes, 2.8 times as strong over the lakes as over land.
See the example

LIVE DEMO - MUNICIPAL
Downtown Pulse
A typical weekday on the 145 road segments the City counted. The 5:30 p.m. peak reaches 44,591 vehicles an hour.
See the example

LIVE DEMO - NONPROFITS & FUNDERS
Ontario community grants since 1999
Every Ontario Trillium Foundation grant since 1999: 32,994 grants and $2.95B, one dot each.
See the example
LIVE DEMO - NONPROFITS & FUNDERS
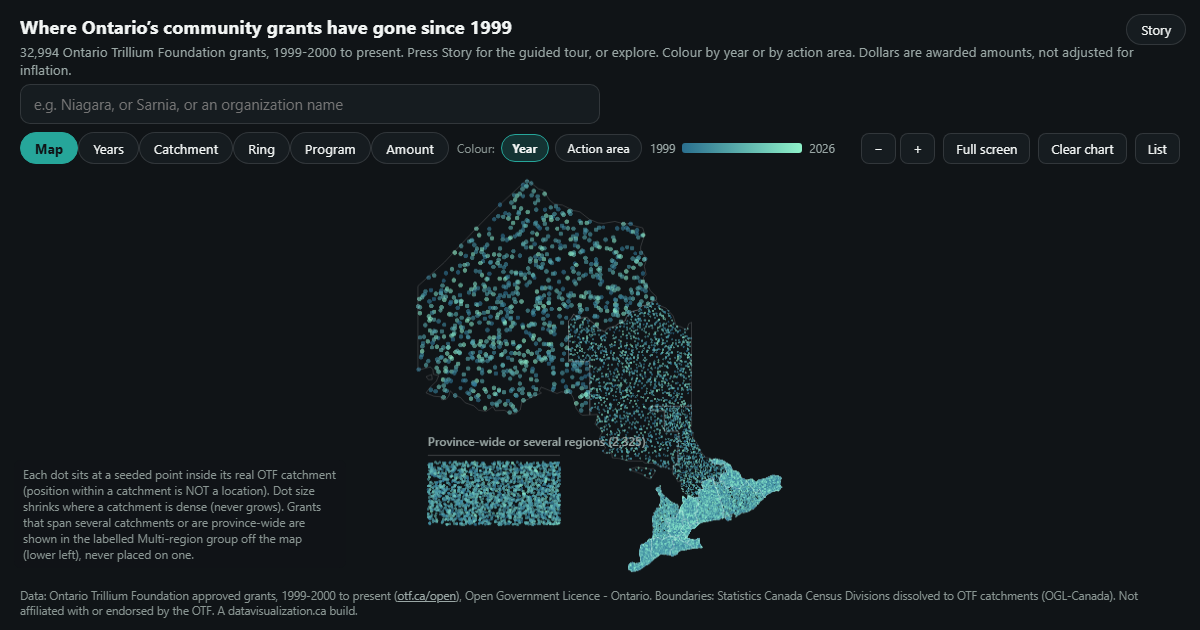
A guided tour of 32,994 grants
Press Story and the grants regroup step by step: the largest region, the biggest program, the peak year.
See the example
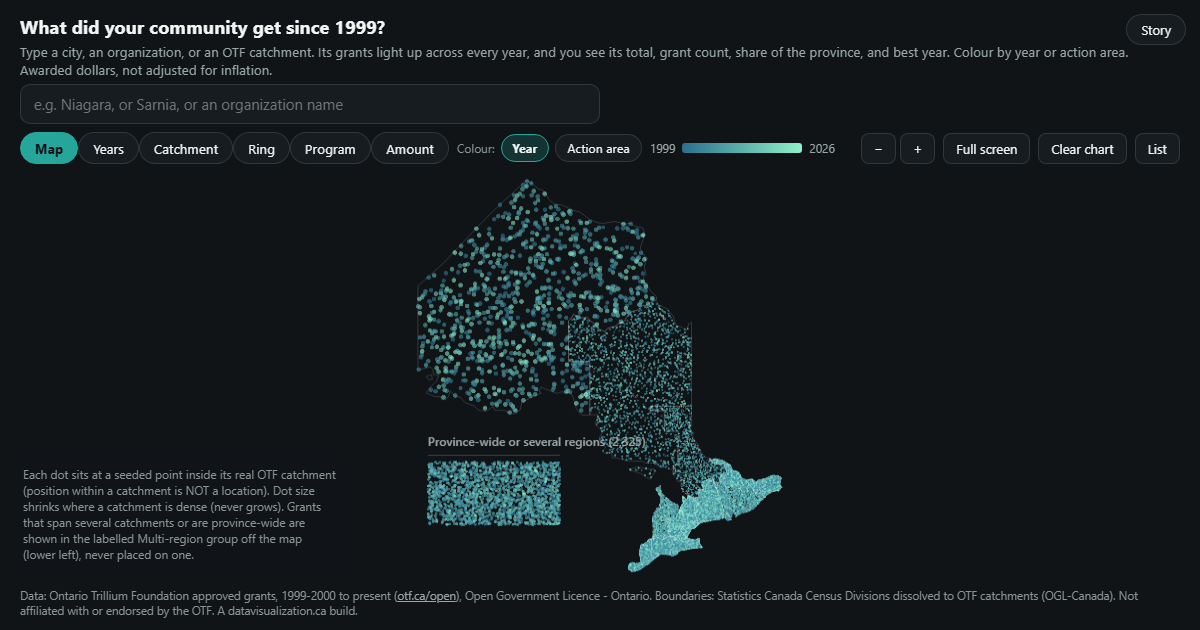
LIVE DEMO - NONPROFITS & FUNDERS
What did your community get?
Type a city, organization or OTF catchment. Its grants light up across every year, with its total, share and best year.
See the example
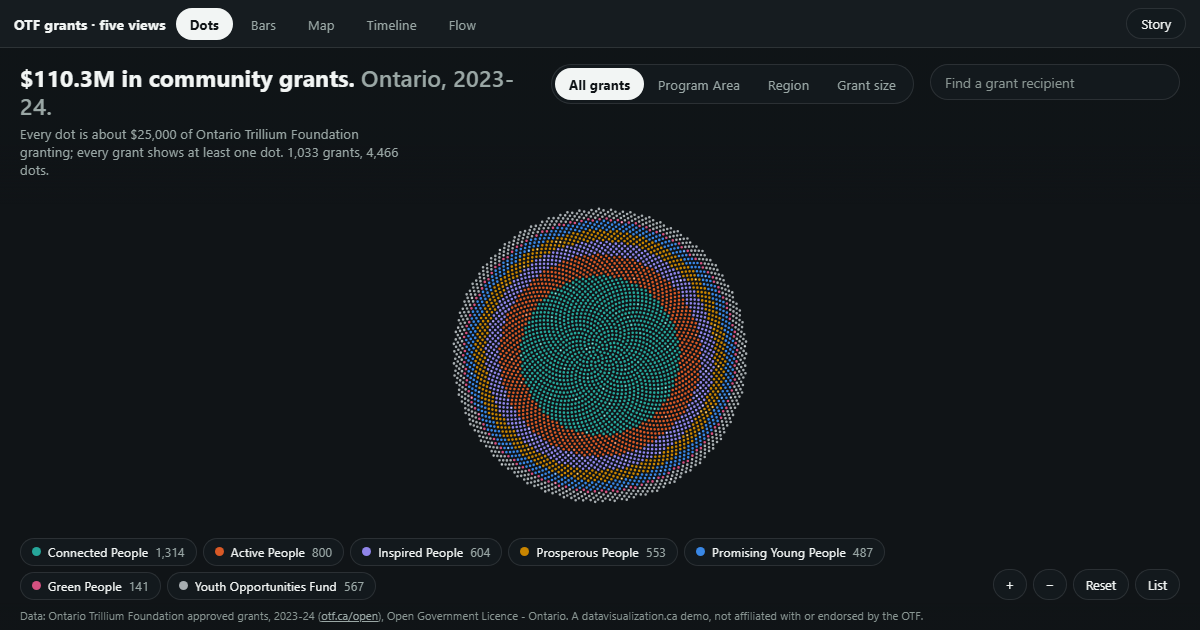
LIVE DEMO - NONPROFITS & FUNDERS
One year of grants, five views
1,033 OTF grants from 2023-24 ($110.3M) as dots, bars, a map, a timeline and a flow.
See the example
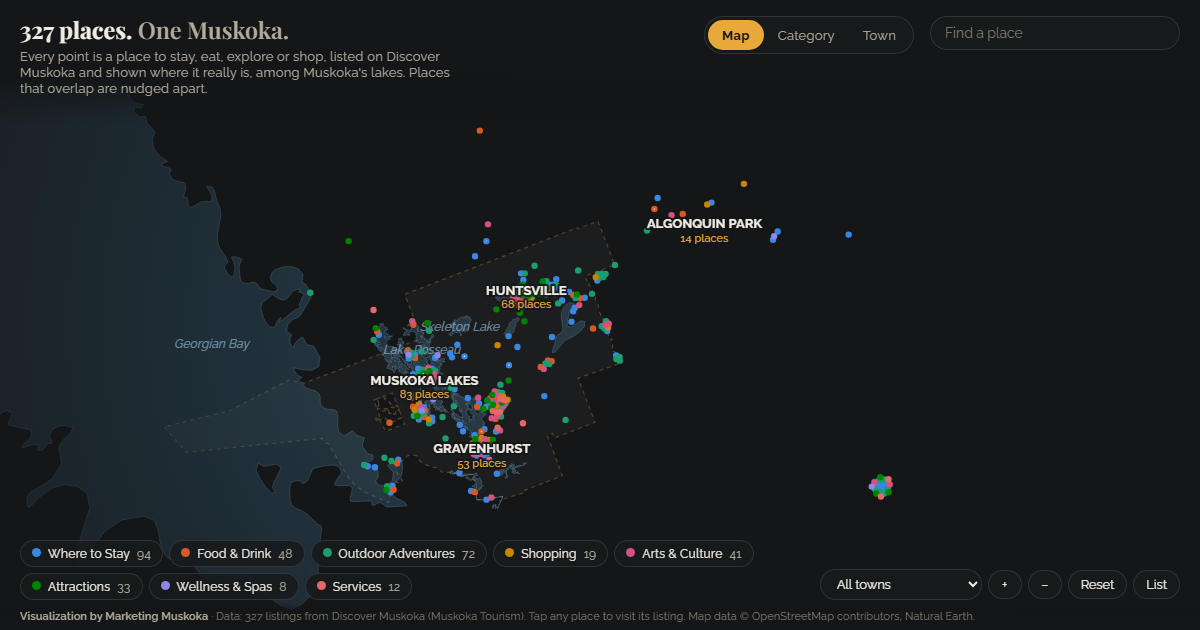
CLIENT WORK - TOURISM
Muskoka tourism
327 tourism listings among Muskoka's real lakes, explored by category and by town.
See the example
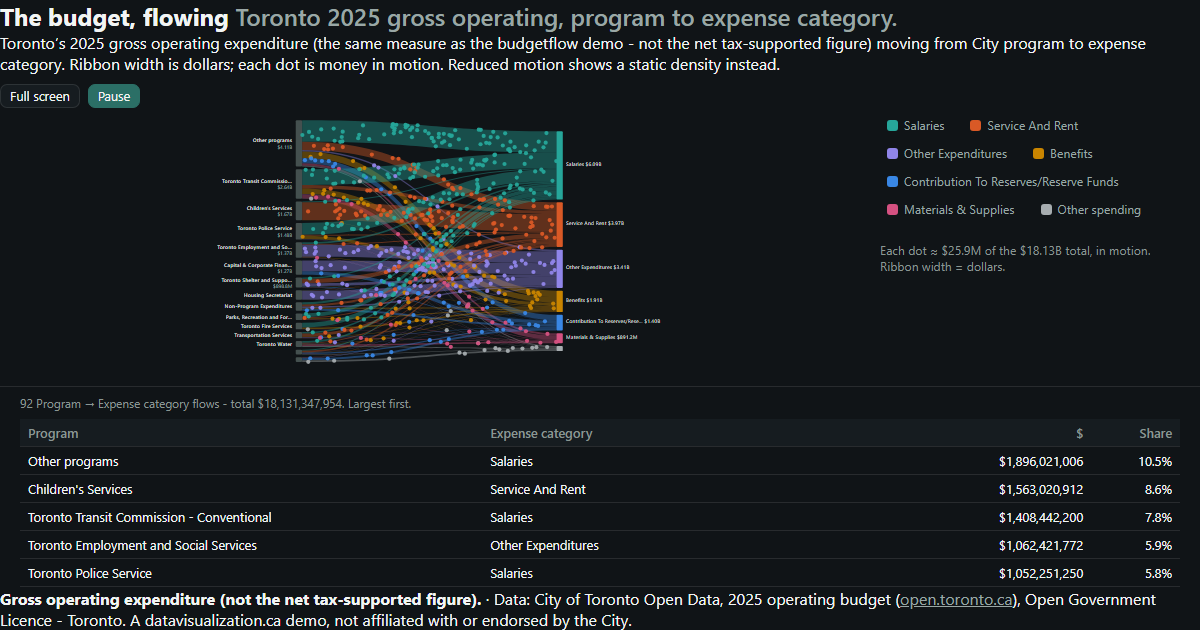
LIVE DEMO - MUNICIPALITIES
Toronto's budget, flowing
$18.13B of 2025 gross operating spending, moving from City programs to what the money is spent on.
See the example
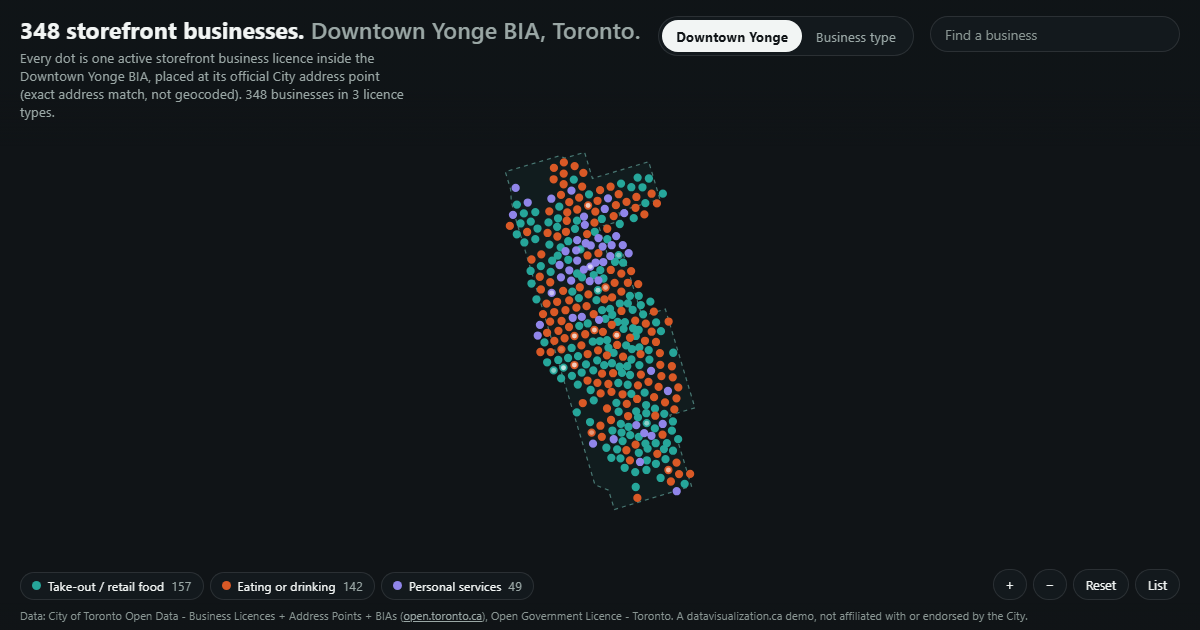
LIVE DEMO - BUSINESS IMPROVEMENT AREAS
Downtown Yonge storefront businesses
348 businesses in the BIA, each at its official City address, by licence type.
See the example
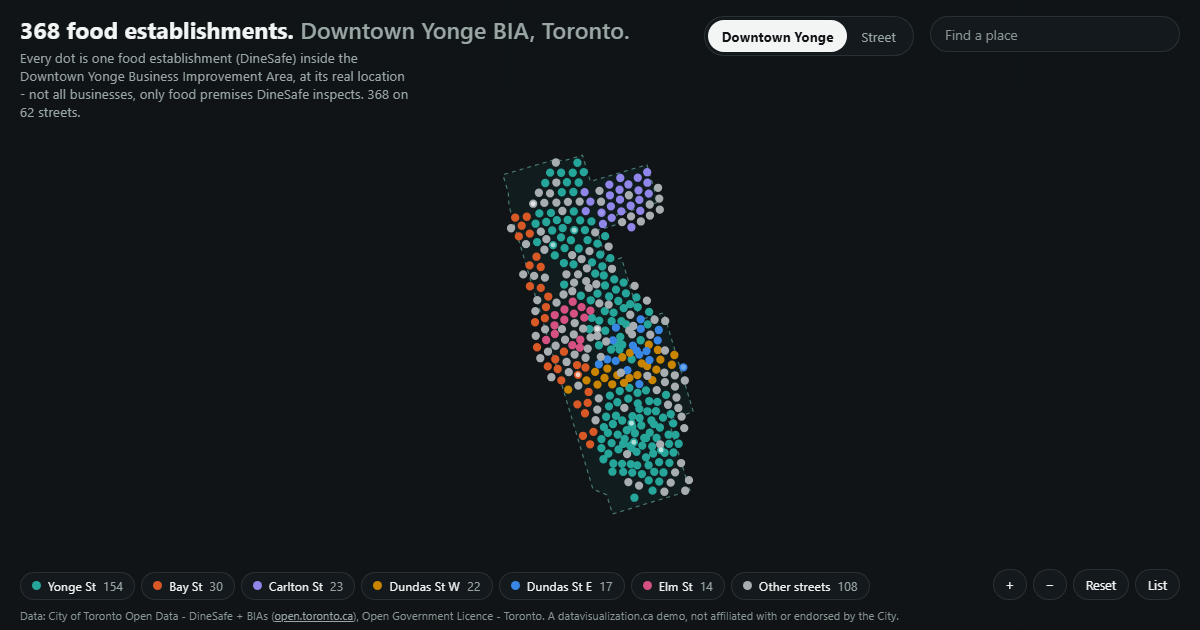
LIVE DEMO - BUSINESS IMPROVEMENT AREAS
Downtown Yonge food premises
368 food premises inspected by DineSafe, on 62 streets inside the BIA, coloured by street.
See the example
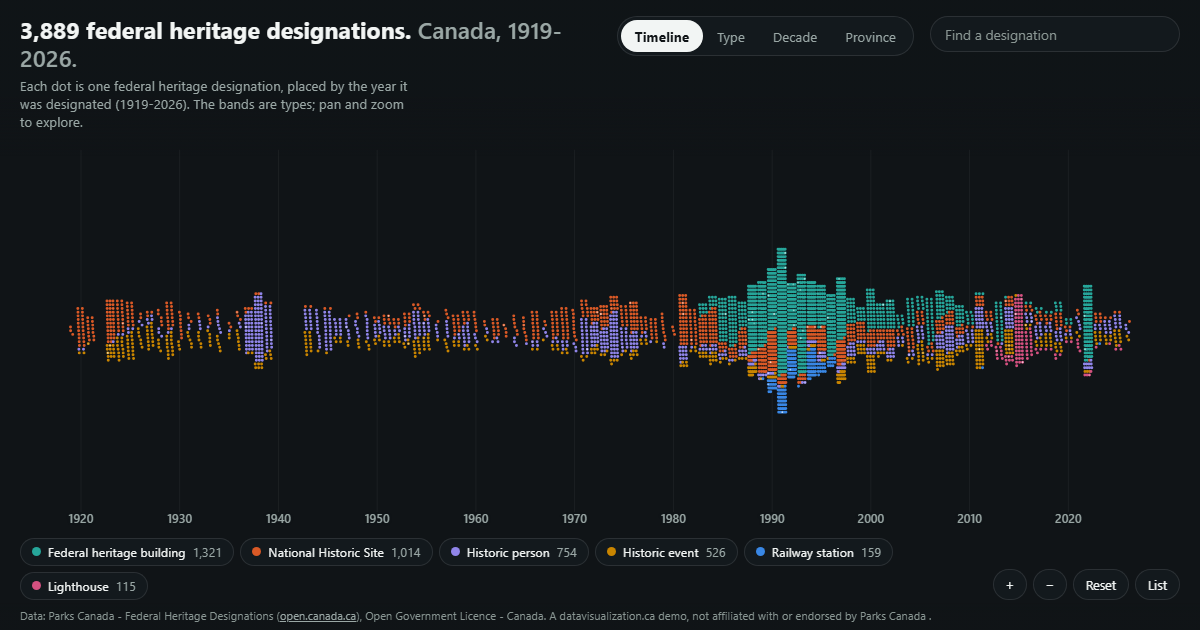
LIVE DEMO - RESEARCH & HERITAGE
Canada's heritage designations over time
3,889 federal heritage designations, each placed by the year it was designated, 1919 to 2026.
See the example
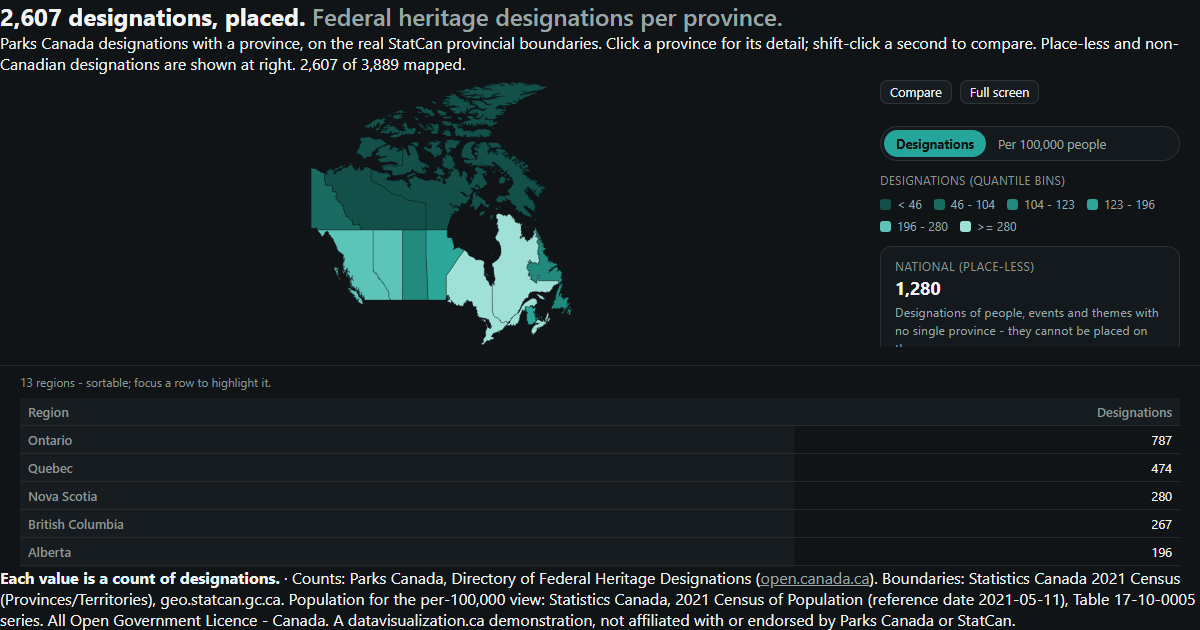
LIVE DEMO - RESEARCH & HERITAGE
Heritage designations by province
2,607 designations on real Statistics Canada provincial boundaries, with the rest shown alongside.
See the example
LIVE DEMO - RESEARCH & HERITAGE
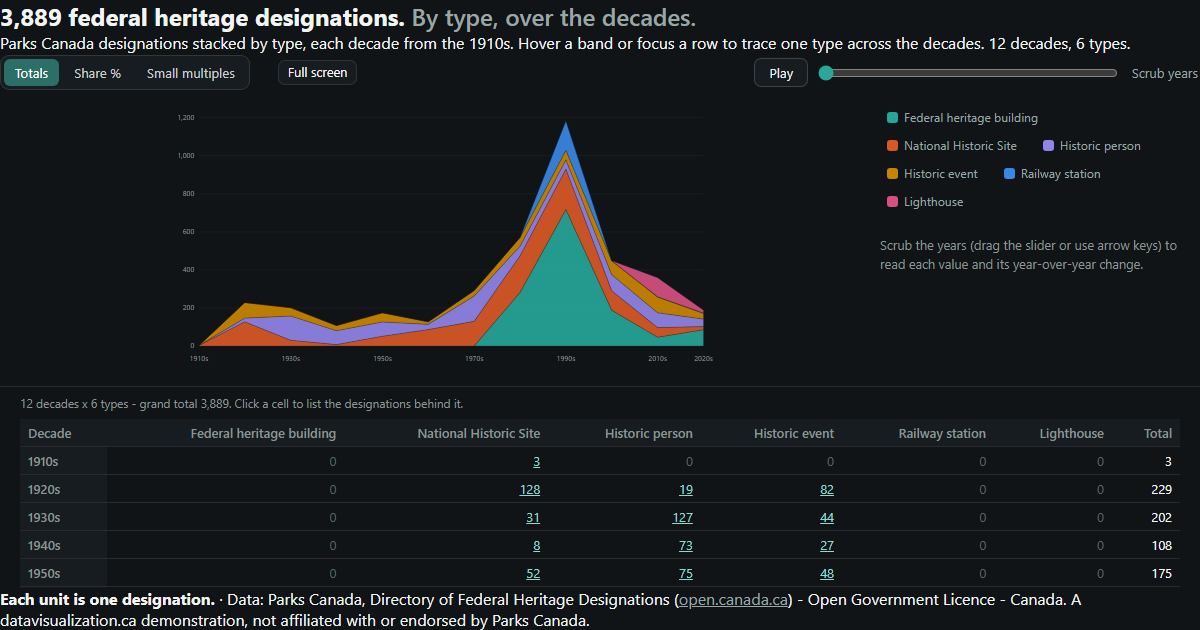
Heritage designations by decade
All 3,889 designations, stacked by type, decade by decade from the 1910s.
See the example

Could your data look like this?
Tell us what you have: a spreadsheet, a database, an open dataset or a website full of listings. We will show you what it could become.