LIVE EXAMPLE - OPEN DATA
How Canada gets to work
Every town-to-town commute in Canada's 2021 Census on one animated night map: 10,680,335 workers, 39,687 home-to-work pairs, and the 4,287,965 who cross a municipal line to get to work. Four narrated tours, a rush-hour timeline, live traffic cameras and an outlook to 2050.
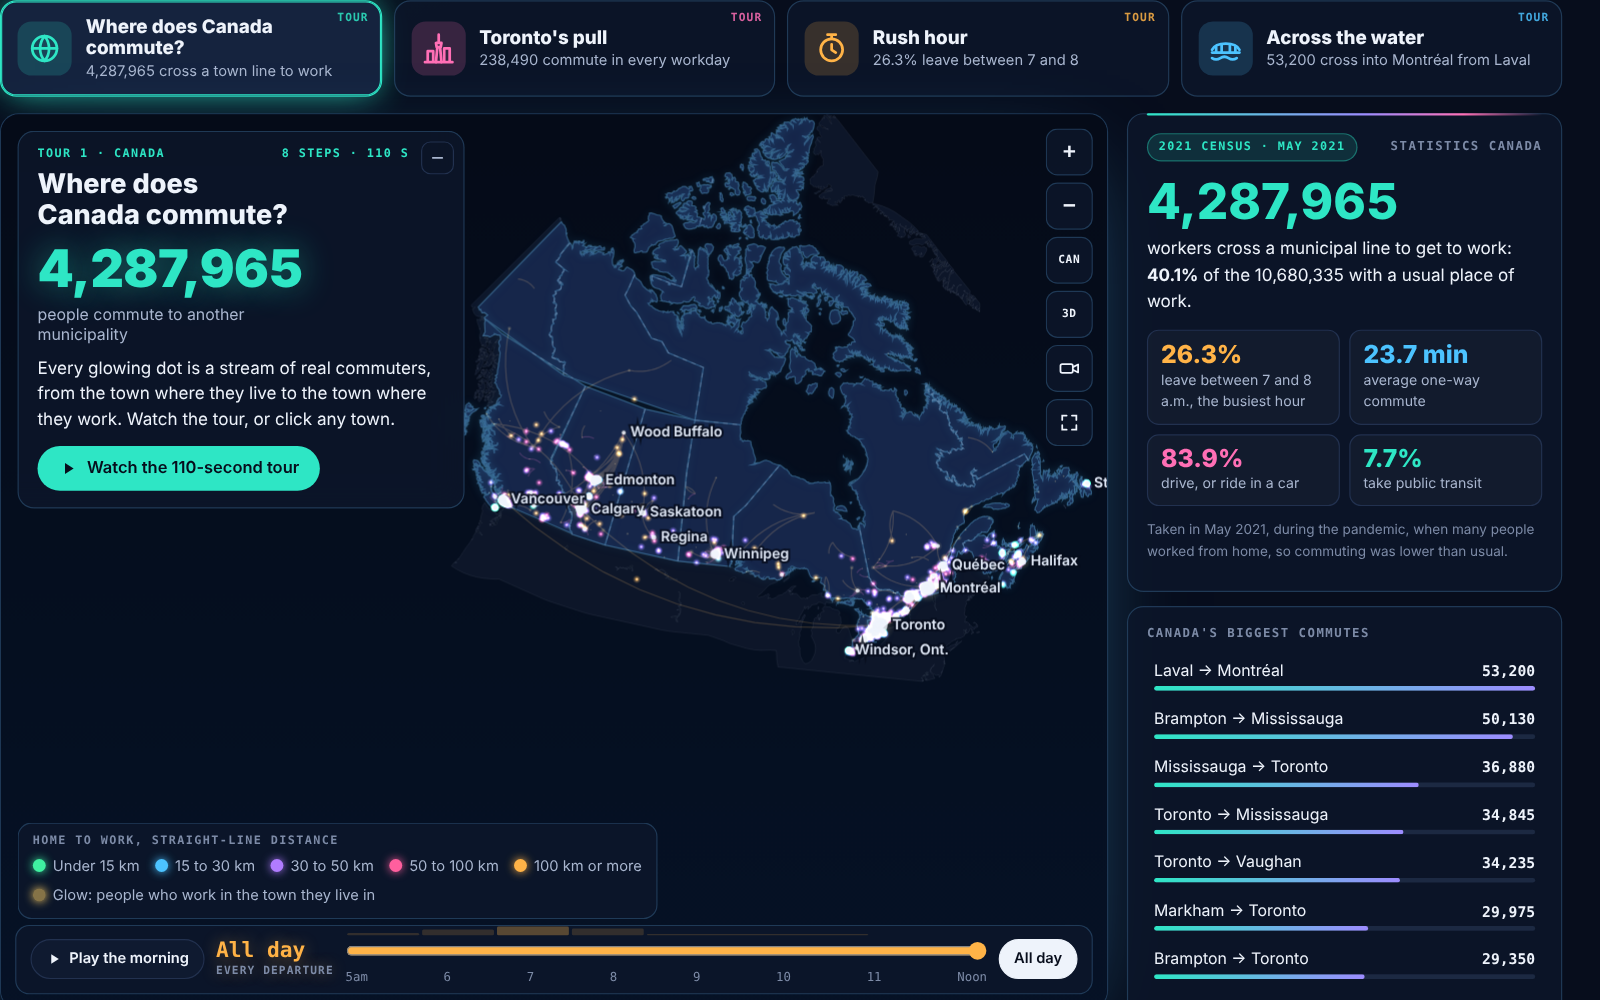
Commuting flows between Canadian municipalities from the 2021 Census. Data: Statistics Canada, Open Government Licence - Canada. Live cameras from Ontario 511, DriveBC, the City of Calgary and Québec 511. Outlook from Statistics Canada and Ontario Ministry of Finance projections. Narration voiced with ElevenLabs. Not endorsed by Statistics Canada or any camera operator.
4,287,965
workers cross a municipal line to get to work
53,200
Laval to Montréal, Canada's busiest commute
26.3%
leave for work between 7 and 8 a.m.
29.8 min
average commute in the Toronto region, the longest in Canada
What the data reveals
INTERACTIVE
How to explore it
About the data
Every figure on this page and on the map is counted from Statistics Canada's published 2021 Census tables. The outlook is a scenario built from official population projections, not a prediction.
- Commuting flows: Statistics Canada, Table 98-10-0459-01, commuting flow from place of residence to place of work by census subdivision, 2021 Census (25% sample). Employed people aged 15 and over in private households with a usual place of work: 10,680,335 workers in 39,687 home-to-work pairs, 4,287,965 of them crossing a municipal line.
- How people travel, how long it takes and when they leave: Statistics Canada Table 98-10-0458-01 (by municipality), 98-10-0457-01 (by census metropolitan area) and 98-10-0460-01 (region-to-region flows). Time arriving at work by census tract: 98-10-0504-01. These include people with no fixed workplace, so their totals are larger than the flow table.
- Map: Statistics Canada 2021 Census boundary files (provinces, metropolitan areas, 5,161 municipalities, census tracts) and the 2021 Road Network File, from Statistics Canada's public map service. Natural Earth (public domain) for the United States and the Great Lakes.
- Live cameras: Ontario 511 (Ministry of Transportation of Ontario, Open Government Licence - Ontario), DriveBC (Open Government Licence - British Columbia), City of Calgary open data, and Québec 511 (Ministère des Transports et de la Mobilité durable du Québec, CC BY 4.0). Pictures load from the operators only when a camera is opened.
- Method: each municipality is drawn at a representative point inside its boundary, and flow lengths are straight lines between those points, so distances are approximate. Statistics Canada randomly rounds every count to a multiple of 5 (or 10). The timeline applies each town's own departure-time mix to all of its flows, because the census does not publish departure times for each town pair.
- Outlook (a scenario, not a prediction): Ontario Ministry of Finance Ontario Population Projections, 2025-2051 for Ontario's 49 census divisions, and Statistics Canada Table 17-10-0057-01 projections by province (low, medium and high growth), measured against 2021 population estimates. Commuters from each town grow with its region's projected population aged 15 to 64; destinations and travel habits stay as in 2021.
- The 2021 Census was taken in May 2021, during the COVID-19 pandemic, when many people worked from home, so commuting was lower than in a typical year.
- Narration voiced with ElevenLabs.
- Contains information licensed under the Open Government Licence - Canada. Not endorsed by Statistics Canada or any camera operator.