LIVE EXAMPLE - OPEN DATA
Where Ontario's community grants went
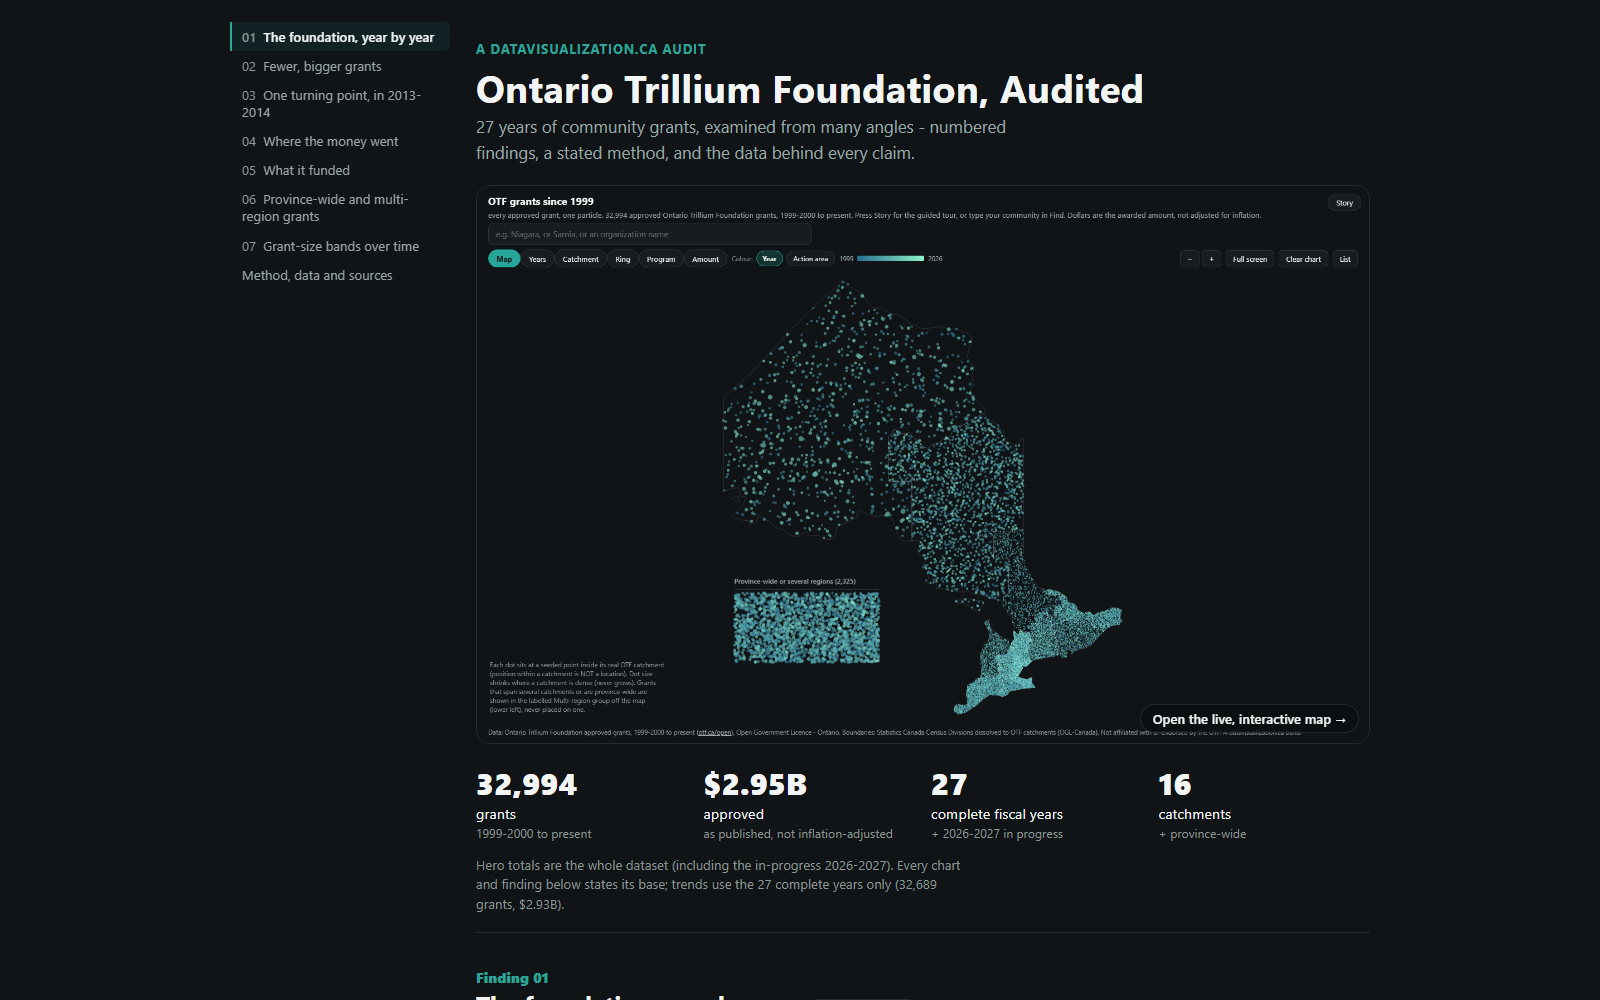
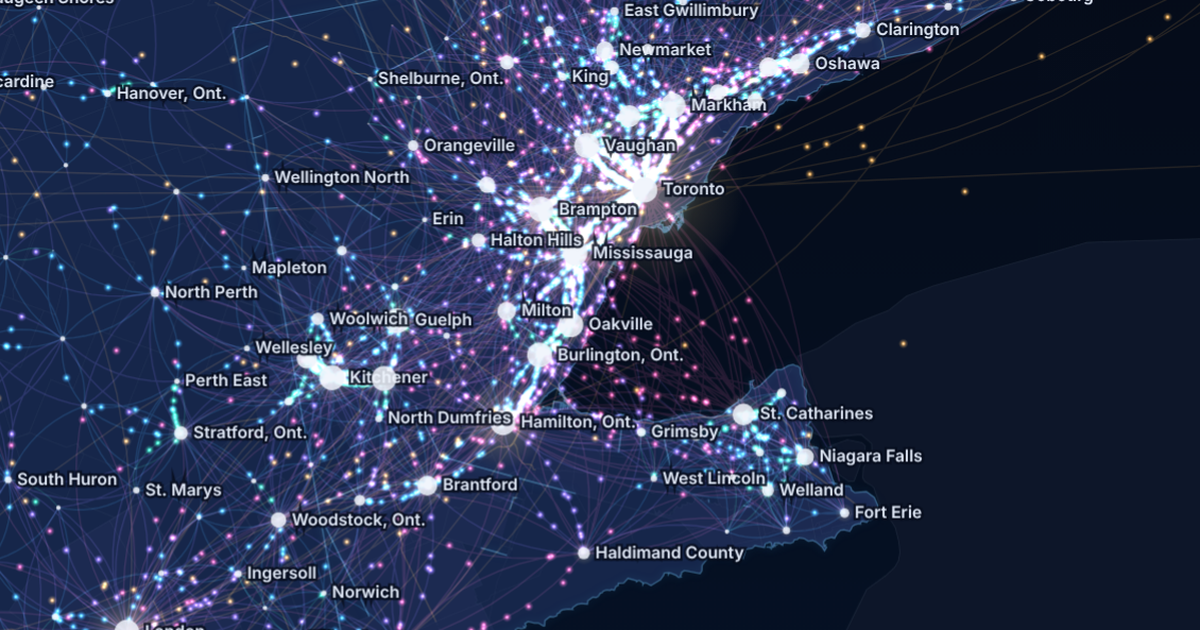
One year of Ontario Trillium Foundation grants, 2023-24: 1,033 grants worth $110.3M to 269 cities and towns in all 16 catchment areas, told in four narrated stories. Where the money went, Toronto's share, how big a grant is, and who gets the most per person.
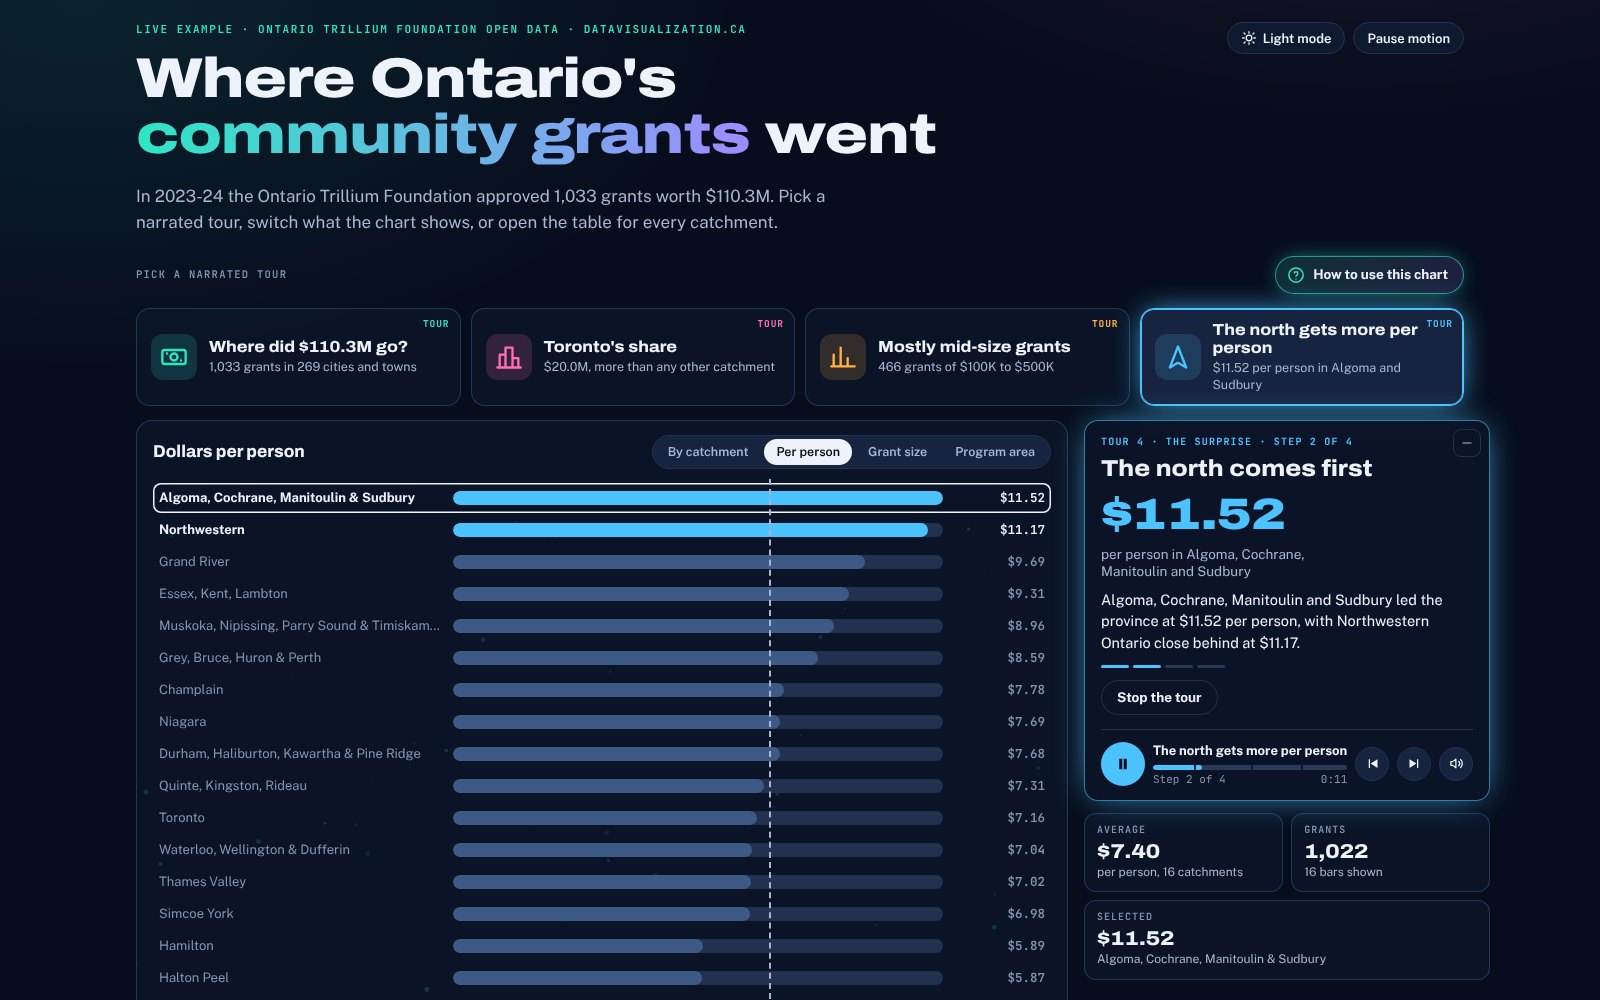
Ontario Trillium Foundation grants approved in 2023-24, by catchment area, grant size and program area. Data: Ontario Trillium Foundation open data, Open Government Licence - Ontario; population from Statistics Canada, Open Government Licence - Canada. Narration voiced with ElevenLabs. Not endorsed by the Ontario Trillium Foundation or Statistics Canada.
$110.3M
granted by the Ontario Trillium Foundation in 2023-24
1,033
grants to 269 cities and towns
18.1%
of the dollars went to Toronto, $20.0M
$11.52
per person in Algoma, Cochrane, Manitoulin and Sudbury, the most in Ontario
What the data reveals
INTERACTIVE
How to explore it
About the data
Every figure on this page and in the chart is computed from the Ontario Trillium Foundation's published open data and Statistics Canada's 2021 Census.
- Grants: Ontario Trillium Foundation open data, every grant approved in fiscal year 2023-24: 1,033 grants worth $110,300,100 to 269 cities and towns.
- Population: Statistics Canada, 2021 Census of Population by census division, added up into the 16 OTF catchment areas.
- Method: dollars per person divide each catchment's grants by its 2021 population. The 11 projects that serve several catchments ($5.0M) are shown on their own and left out of the per-person view.
- Narration voiced with ElevenLabs.
- Contains information licensed under the Open Government Licence - Ontario and the Open Government Licence - Canada. Not endorsed by the Ontario Trillium Foundation or Statistics Canada.