Home Examples Above the Falls

LIVE EXAMPLE - OPEN DATA

Above the Falls

How Lake Erie's water moves down the upper Niagara River, around both sides of Grand Island to the hydro intakes above the falls. A transparent estimate built from NOAA chart depths and the hourly flow measured at Fort Erie, September 10 to 23, 2026. Modelled estimate, not measured currents.

Upper Niagara River, modelled currents scaled hour by hour to the measured discharge at Fort Erie, September 10 to 23, 2026. Depths: NOAA Electronic Navigational Charts (US government work). Discharge: Environment and Climate Change Canada, Water Survey of Canada real-time data (Open Government Licence - Canada). Water level: NOAA CO-OPS (public domain, preliminary). Falls and lake outline: Ontario Hydro Network (Open Government Licence - Ontario).

5,960 m3/s

Lake Erie's average measured outflow at Fort Erie over the 13 days

63.1%

of the flow down the Chippawa Channel, modelled (published: about 60%)

2.8 m

median daytime rise in the water level below the falls

13 days

of hourly flow, September 10 to 23

What the data reveals

LAKE ERIE

The river rises and falls with the lake

Measured at Fort Erie, Lake Erie's outflow ran between 4,990 m3/s (Sep 22, 3 a.m.) and 6,510 m3/s (Sep 16, 5 a.m.), hourly means, averaging 5,960 m3/s over the 13 days. The modelled currents rise and fall with it.

GRAND ISLAND

Most of the water takes the Canadian side

As a modelled estimate, 63.1% of the river goes down the Chippawa Channel, west of the island, and 36.9% down the Tonawanda Channel. The International Niagara Board of Control publishes "approximately 60 percent" for the Chippawa Channel.

BELOW THE FALLS

You can see the treaty in the water level

Below the falls, the measured water level ran a median 2.8 m higher in the daytime (10 a.m. to 7 p.m.) than overnight (midnight to 6 a.m.), on all 13 days: the 1950 Niagara Treaty's day and night schedule, seen as a water level, not a flow.

SEPTEMBER 16

The evening drop comes two hours earlier

The evening fall in that water level started around 10:00 p.m. before Sept 16 and around 8:00 p.m. from Sept 16 on, when the treaty's daytime hours end earlier.

INTERACTIVE

How to explore it

Three ways to see the river

Flow animates the streaks, Speed shades the river by modelled speed, and Streamlines draws the paths as still lines.

Scrub through 13 days

Drag the timeline or press Play. Markers jump to the highest and lowest inflow and the September 16 rule change.

Gauges and the treaty

See the Fort Erie flow gauge, the water level below the falls, and the treaty schedule in force on each date.

Read any spot

Hover or tap the river for modelled speed and direction. Drag the cards out of the way, or collapse them.

Zoom and pan

Ctrl and scroll, pinch, or the + and - buttons. Reset view puts everything back.

Keyboard and table

Arrow keys move a probe along the river with each reading announced. The Table lists every hour.

About the data

Every figure on this page is computed from the data in the visualization, and the visualization says plainly what is measured and what is modelled.

  • What this is: a modelled estimate from NOAA depths and the Fort Erie gauge, not measured currents. No openly licensed model of currents covers this river: NOAA's Lake Erie and Lake Ontario models and ECCC's WCPS stop at the Peace Bridge or start below the falls.
  • Method: the river is split into cells about 60 m across. In every cross-section the water is shared out in proportion to depth to the power 5/3 (deeper water flows faster, as in Manning's formula); speed is water per metre of width divided by depth. The total through every cross-section equals the measured Fort Erie discharge for that hour.
  • Grand Island split: modelled 63.1% Chippawa, 36.9% Tonawanda. Published: "approximately 60 percent" for the Chippawa Channel (International Joint Commission / International Niagara Board of Control, 2020-2021 Ice Boom Report). Difference: +3.1 percentage points.
  • Depths: NOAA Electronic Navigational Charts 14832 and 14833 (US government work). Discharge: Water Survey of Canada station 02HA013, Niagara River at Fort Erie, provisional real-time data, Open Government Licence - Canada.
  • Water level below the falls: NOAA CO-OPS station 9063007, Ashland Ave (public domain, preliminary). It is a water level, never converted to a flow.
  • The model stops at the hydro intakes. Below them nothing is modelled: the diversions around the falls are not measured hourly. Not a hydraulic model: no eddies, wind, ice or rapids.
Have data about water, roads or networks?

River flow, pipes, routes or shipments: we build honest, explorable maps that say what is measured and what is modelled. Tell us about your data.

More flows

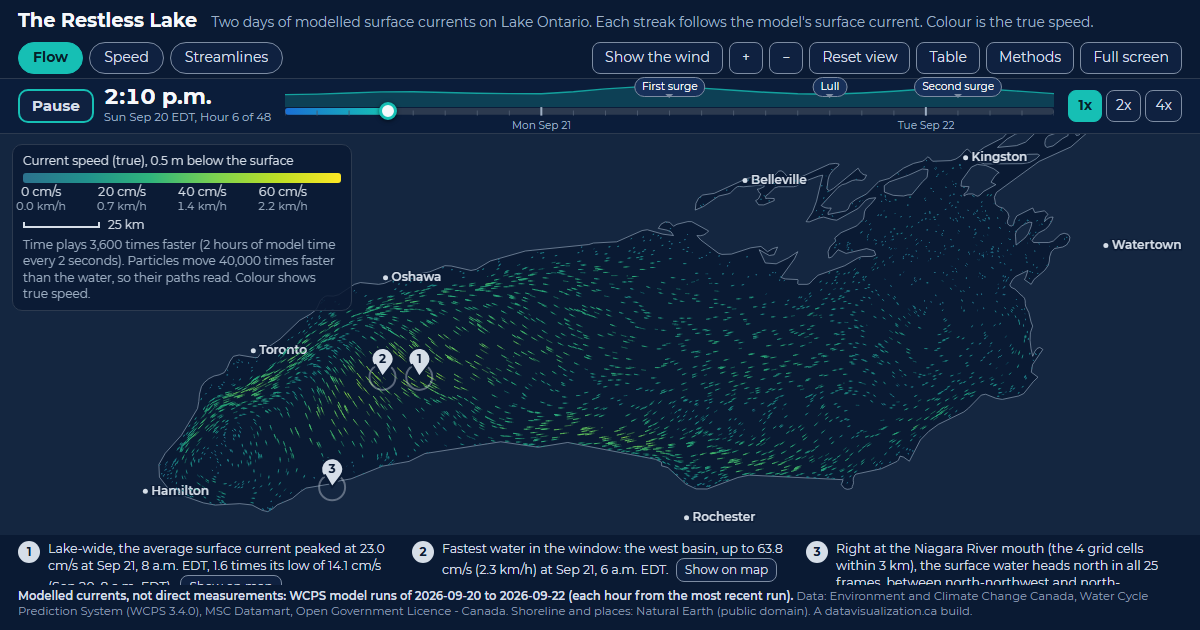
The Restless Lake: Lake Ontario filled with glowing streaks that follow the modelled surface current, coloured by speed.

The Restless Lake

Lake Ontario currents. 23.0 cm/s lake-wide average current at its peak, Sep 21, 8 a.m. EDT.

See the example

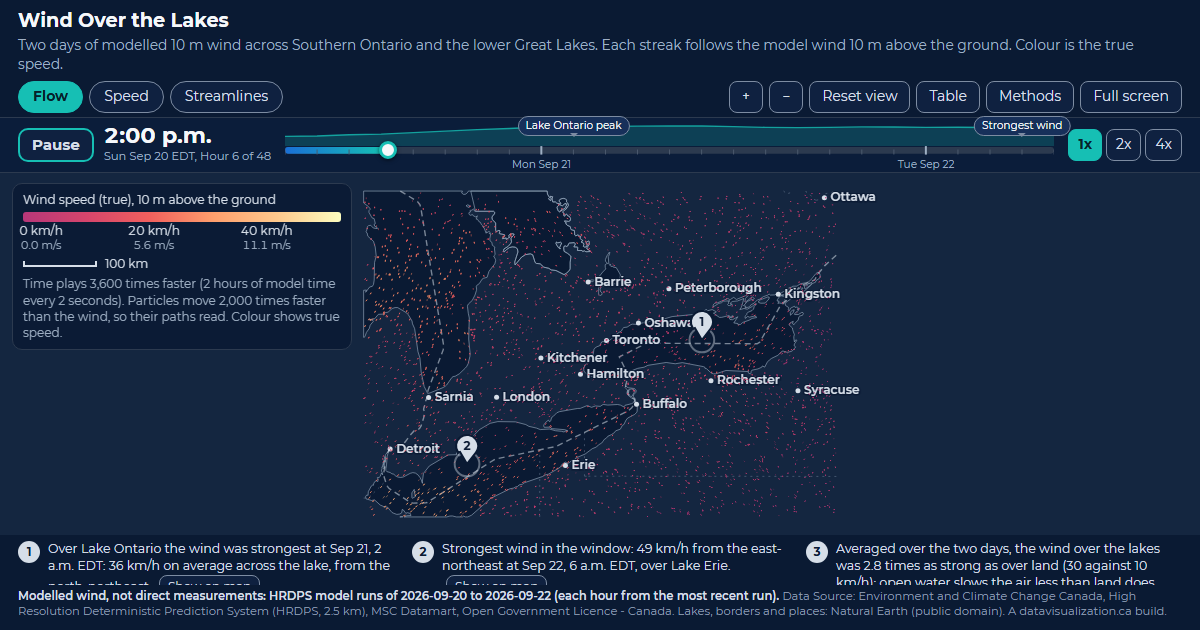
Wind Over the Lakes: Southern Ontario and the lower Great Lakes scattered with streaks that follow the modelled 10 m wind, coloured by speed.

Wind Over the Lakes

Southern Ontario wind. 49 km/h strongest wind in the window, over Lake Erie, Sep 22, 6 a.m. EDT.

See the example

Downtown Pulse: downtown Toronto streets with glowing counted road segments and small dots travelling along them, coloured by measured speed.

Downtown Pulse

Downtown Toronto traffic. 44,591 vehicles an hour across all counted directions at the 5:30 p.m. peak.

See the example