Home Industries Environmental Conservation and Protection

INDUSTRIES

Data Visualization for Environmental Conservation and Protection

We turn monitoring, habitat and climate data into interactive maps and stories that the public, funders and councils can explore on their own.

THE CHALLENGE

Make the change visible

Conservation groups and environmental agencies collect years of careful data: water quality, species counts, forest cover, flows and climate. Most of it is published as technical reports and data files, so the public never sees what the data shows.

An interactive visualization lets people watch the water move, see the habitat change and understand why your work matters, with measured and modelled data labelled honestly.

TODAY

  • Watershed and monitoring reports as long PDFs
  • Years of field data that few people see
  • A public that cares but cannot see the change

WITH AN INTERACTIVE VISUALIZATION

  • Living maps of water, land and wildlife
  • Change over time anyone can follow
  • Open to everyone, WCAG 2.1 AA

Questions the public and funders ask

WHAT WE BUILD

What we build for conservation

Watershed and habitat maps

Rivers, wetlands, forests and protected areas on a real map, with your monitoring sites.

Flow and current viewers

Water, wind or ice animated on a map from measured or modelled data, labelled honestly.

Long-term monitoring trends

Years of water quality, species or climate data animated, with a text table behind every chart.

Species and migration stories

Sightings and migrations as moving maps people can follow season by season.

Restoration and project maps

Every project with its status and results, so funders see the progress.

Branded funder reports

Staff download a branded PDF or PowerPoint of the exact view for funders and councils.

LIVE EXAMPLES

See it working

Live examples built from real environmental data from Environment and Climate Change Canada and others, with modelled data labelled as modelled. Every number comes from the published source.
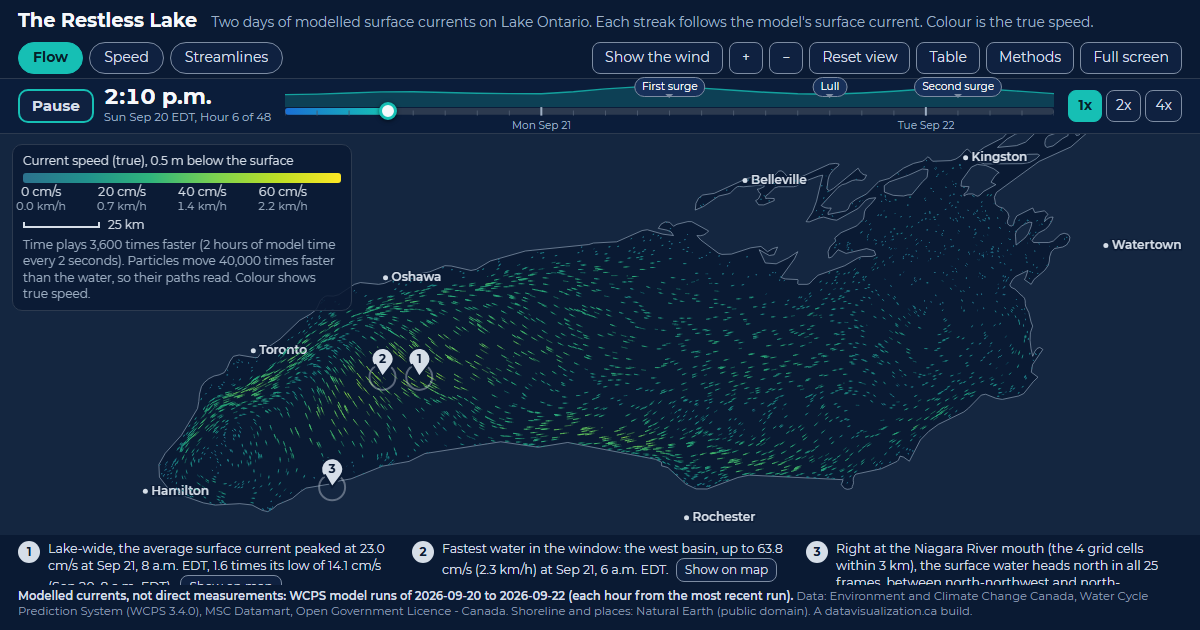
The Restless Lake: Lake Ontario filled with glowing streaks that follow the modelled surface current, coloured by speed.

ENVIRONMENT - WATER

The Restless Lake

Two days of modelled surface currents on Lake Ontario. Every streak follows the current; the west basin peaks at 63.8 cm/s.

See the example

Toronto Grid Pulse: every streetlight pole in Toronto as a glowing dot on the City's mapping, brightest downtown, with major roads labelled.

ENVIRONMENT - RIVERS

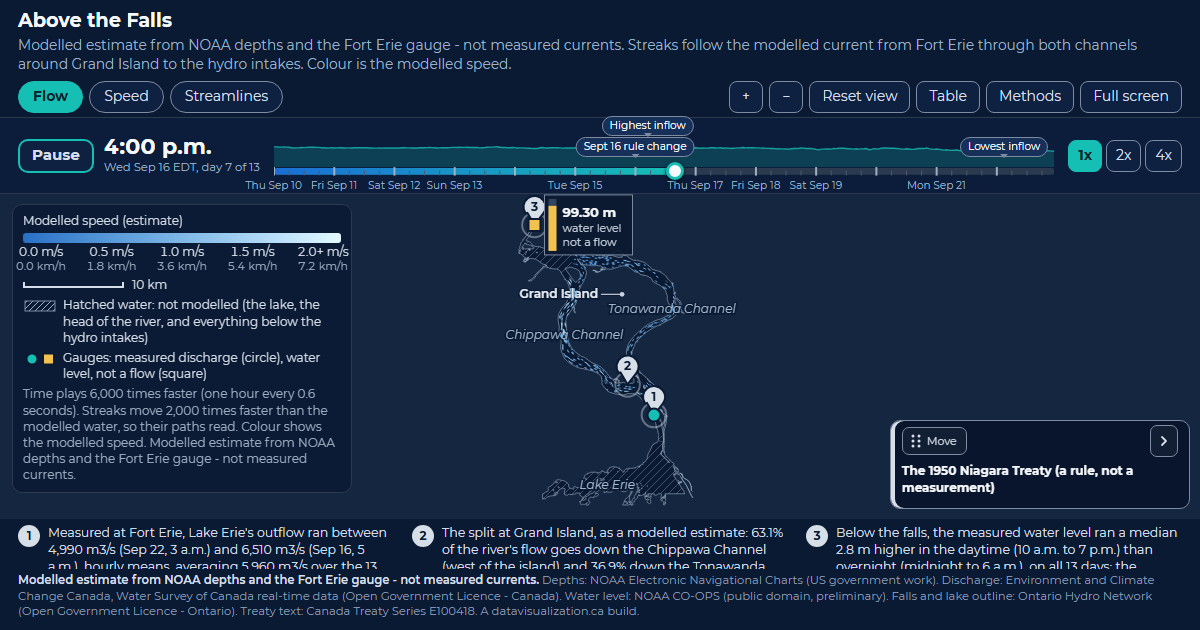
Above the Falls

Lake Erie's water around Grand Island to the hydro intakes. Modelled, 63.1% takes the Chippawa Channel; the published figure is about 60%.

See the example

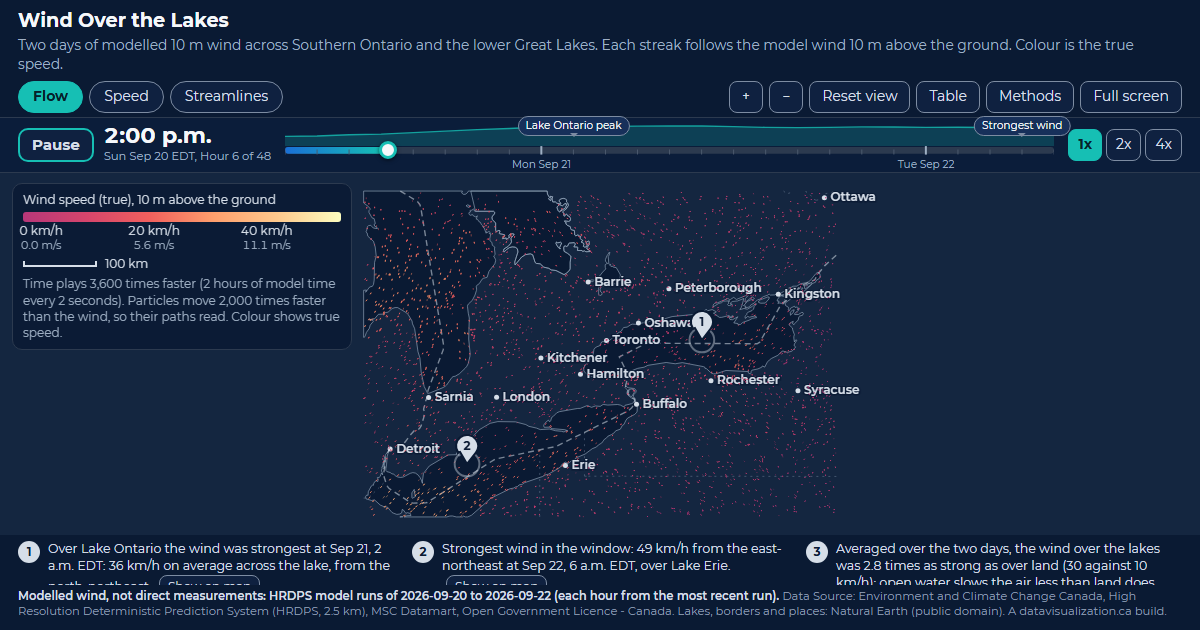
Wind Over the Lakes: Southern Ontario and the lower Great Lakes scattered with streaks that follow the modelled 10 m wind, coloured by speed.

ENVIRONMENT - CLIMATE

Wind Over the Lakes

Two days of modelled wind over Southern Ontario and the lower Great Lakes, 2.8 times as strong over the lakes as over land.

See the example

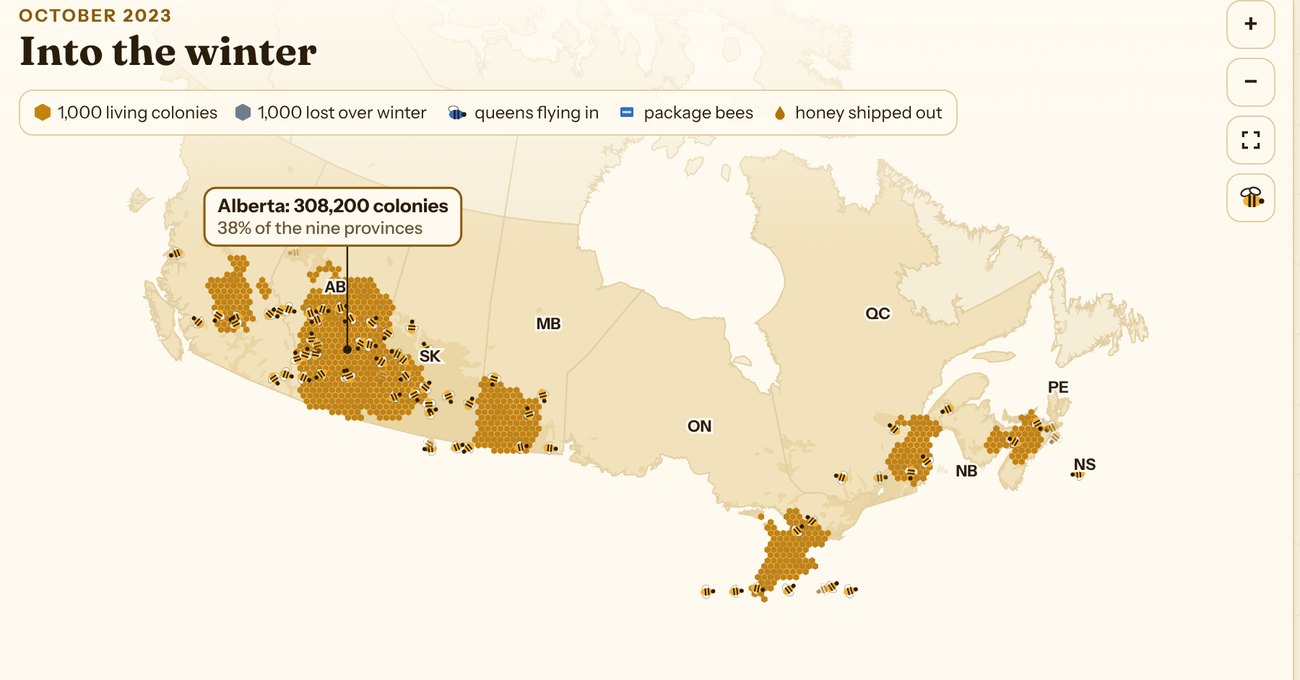
Canadian Honey Bee Explorer: a map of Canada with honey bee colonies drawn as golden hexagons, about 1,000 colonies each, clustered in Alberta, Saskatchewan, Manitoba, Ontario, Quebec and the Maritimes. Alberta holds 308,200 colonies, 38% of the nine provinces.

ENVIRONMENT - POLLINATORS

Canadian Honey Bee Explorer

854,653 colonies, a century of honey and every winter's losses since 2007, in four narrated stories with a map for each.

See the example

YOUR DATA

Built from data you already monitor

Field data, monitoring stations and public environmental datasets are a strong start. If it fits in a spreadsheet or a map layer, it can be visualized.

  • Water quality monitoring
  • Stream flow and levels
  • Species counts and sightings
  • Forest and wetland cover
  • Climate and weather records
  • Protected area boundaries
  • Restoration projects
  • Invasive species reports
  • Air quality readings
  • Citizen science observations

AODA / WCAG 2.1 AA

Open to everyone, AODA ready from day one

Ontario's AODA requires public sector organizations, including conservation authorities, and nonprofits with 50 or more employees, to make their websites meet WCAG 2.0 Level AA. Every visualization we build meets WCAG 2.1 AA, a newer and stricter standard, so it can go on your site without a retrofit.

Text table behind every chart

Every number can be read without the picture

Full keyboard access

Every control works without a mouse

Screen reader announcements

Changes are read out as people explore

Reduced motion respected

Animation can be paused or turned off

WCAG 2.1 AA on every build

WAYS TO WORK WITH US

Build it, licence it, or both

Every project is quoted after a discovery call, and we can work to a grant budget. These are the three ways conservation teams usually work with us.

Custom build

We design and build a visualization around your watershed, your data and your community, ready to embed on your site.

Licence

Use one of our ready-made visualizations with your own data and branding, on a monthly or yearly plan.

Build and licence

A custom build to start, then a licence that keeps it hosted and refreshed as new monitoring data comes in.

HOW IT WORKS

From first call to public launch

1

Discovery call

Tell us what the public and funders need to understand and what data you have. We suggest what the experience could look like.

2

Scope and quote

We review the data, confirm what it can honestly show, and send you a quote.

3

Build and review

You see a working draft early, and we refine it with your scientists and staff.

4

Launch and update

It goes live on your website and can be refreshed as new monitoring data arrives.

Questions conservation teams ask us

Yes, and we label it clearly. Our Lake Ontario and Niagara examples show modelled currents and check them against published figures.
Yes. Locations can be generalized to a grid or region, or left out, so rare species are never put at risk.
Yes. The same visualization works on your website, in a funder presentation and as a downloadable branded report.
Yes. Every build meets WCAG 2.1 AA, with full keyboard access and a text version of every chart.
Every project is quoted. The price depends on the size and condition of your data, the number of views, and features like maps, tours or downloadable reports. See what affects pricing, or book a discovery call for a quote.

Help people see what you protect

Tell us about your work and the data you monitor. We will show you what an interactive experience could look like and what it takes to build it.