
Statistics Canada's latest Census of Environment release holds a story that is hard to chart. Field crops hit a record, while sea fishery landings keep falling. Put both on one chart without a plan and one of them disappears.
What the Census of Environment reports
Statistics Canada reports that agricultural ecosystems supplied 146.6 million tonnes (Mt) of biomass in 2025. That total includes field crops, hay, vegetables, fruit and honey. Field crops, meaning grains, oilseeds and pulses, reached 109.3 Mt, which is 11% more than the year before. The agency credits favourable growing conditions that raised yields.
Three provinces each set a record. Saskatchewan produced 42.7 Mt, Alberta 28.4 Mt and Manitoba 15.7 Mt. In the same release, Statistics Canada reports that Canada's sea fisheries landed their smallest catch since 2002 in 2024. That was the fifth annual decline in a row.
Alberta also shows a different kind of change. Statistics Canada reports that its vegetable harvest rose from 0.7 Mt to 1.6 Mt between 2002 and 2025. The province also accounted for 19% of the national timber harvest in 2024.
Why one shared axis fails
The scale gap is the first problem. In 2022, Statistics Canada reported nearly 270 Mt of commercial biomass. Of that, 138 Mt (51.2%) came from agricultural ecosystems and 131 Mt (48.5%) from forests. Marine, coastal and freshwater ecosystems supplied 0.8 Mt (0.3%).
Plot those in tonnes on one axis and the fish line looks flat. A flat line hides a fifth straight annual decline. Your reader would conclude that nothing is happening to fish, which is the opposite of the finding.
The second problem is timing. The crop record is for 2025. The fish low is for 2024. If you place them on one year marker, you imply they match. They do not.
Three ways to chart the series
You have three series to show: crops, timber and fish. Each one needs its own room. These options work well together.
- Small multiples. Give each ecosystem its own panel with its own tonnes scale. Label each axis clearly. The reader sees every series at its real size.
- An indexed line chart. Set a base year to 100 and show change from there. Statistics Canada's table starts in 2002, so that is a natural base. This compares direction, not volume, so say so in the chart subtitle.
- A share-of-total bar. Show each ecosystem's share of total biomass for a given year. Use this to show how the mix is shifting. Keep tonnes in a second view so the record is not lost.
Lead with the small multiples. Use the indexed view as a second step for readers who want to compare. Keep the story in that order: the record first, then the fish decline, then what the two have in common.
Be honest about what the numbers leave out
Statistics Canada states that these estimates count commercial harvesting only. They exclude subsistence, recreational and cultural harvesting, including harvesting for Indigenous food, social and ceremonial use. A falling commercial landing is not the same as a falling total catch from the water.
Put that note near the chart, not in a footer. Our rule is that gaps stay gaps. If a year is missing for a province, show a break in the line. Do not draw a line across it.
Also keep the scope clear. The release covers provisioning services, which are the goods ecosystems supply, such as food, wood, water and fuel. It does not cover regulating or cultural services.
A checklist before you publish
Use this list when you build a harvest story for members, donors or a policy brief.
- Pull the series from Statistics Canada table 38-10-0171-01 and note the release date on the chart.
- Check the year for every series. Say plainly when one series ends in 2024 and another in 2025.
- Start tonne axes at zero for bars. Never trim the axis to make a record look larger.
- Label the commercial-only limit in the subtitle or the first note.
- Do not rely on colour alone. Use direct labels and different line styles.
- Add a text summary and a data table under each chart for screen reader users.
- Pull timber figures straight from the table. Do not state a timber trend unless you have checked the numbers yourself.
Our accessibility page explains more about how we approach accessible charts, including data tables and text summaries.
Where this fits in agricultural work
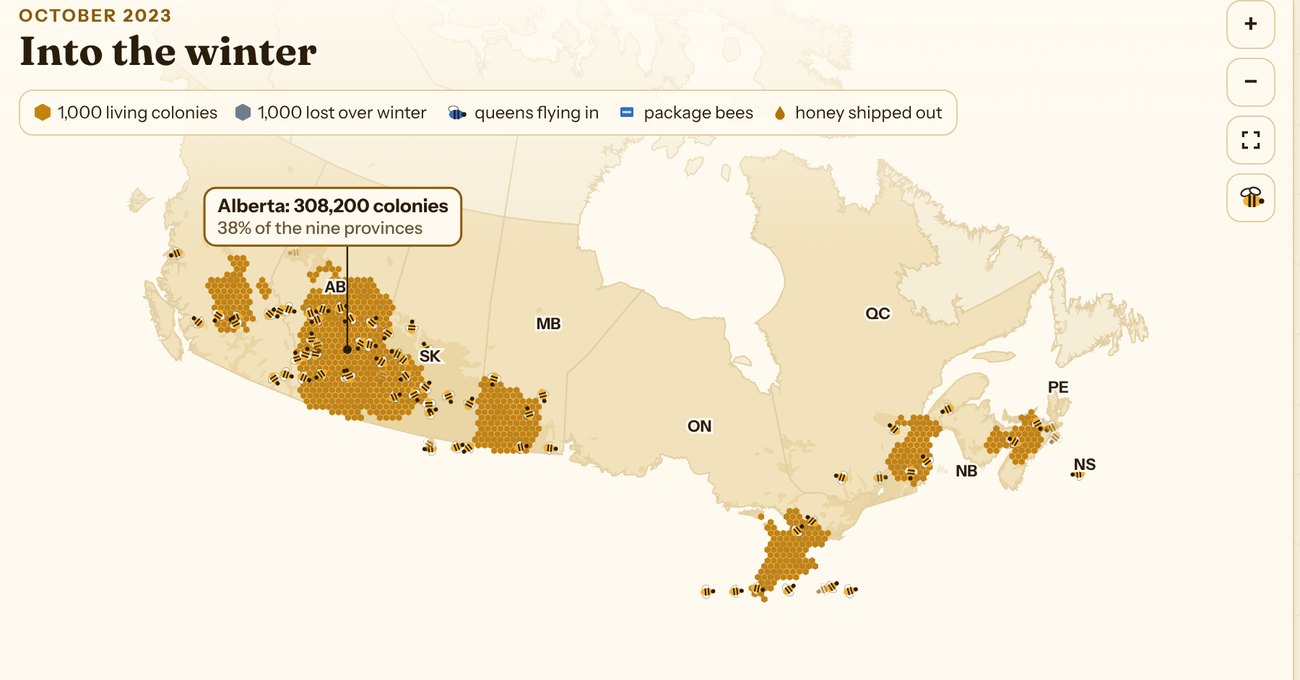
Associations and policy teams often need to show a good-news number next to an uncomfortable one. A clear layout lets both stand. Our agriculture and agri-food work follows the same approach: name the source, show the gaps, and keep the language plain. For an example of agricultural data told as a story, see the Canadian Honey Bee Explorer.
If you want to try your own series, try it with your data to see how a layout like this would look.
If you want a harvest story built from Statistics Canada data for your members or board, book a discovery call and we will talk through the options.