Home Examples Downtown Pulse

LIVE EXAMPLE - OPEN DATA

Downtown Pulse

A typical weekday of measured traffic in downtown Toronto, from just west of Bathurst St to just east of Parliament St, built from 229 City of Toronto counts taken on weekdays from 2022 to 2026. Dots move only on the 145 road segments the City actually counted.

Downtown Toronto, a typical weekday at 15-minute resolution built from midblock traffic counts taken in 2022 to 2026 (weekdays only, statutory holidays excluded). Data: City of Toronto Open Data, Transportation Services. Contains information licensed under the Open Government Licence - Toronto.

44,591

vehicles an hour across all counted directions at the 5:30 p.m. peak

41,148

vehicles an hour at the morning peak, 8:45 a.m.

145

counted road segments, 273 directions, from 229 counts

15 km/h

slowest busy segment at 5:30 p.m., University Ave northbound

What the data reveals

THE EVENING PEAK

The evening rush is bigger than the morning

Added across all 273 counted directions, the typical weekday peaks at 5:30 p.m. with 44,591 vehicles an hour, against 41,148 an hour at the morning peak (8:45 a.m.).

UNIVERSITY AVE

The busiest counted street with a measured speed

University Ave southbound, from just south of Adelaide St W to Pearl St: about 13,500 vehicles on a typical weekday, peaking at a rate of 860 an hour at 9:00 a.m., at 21 km/h (from a single count, 2025).

THE SLOWEST

Busy and slow at 5:30 p.m.

University Ave northbound, from Pearl St to just south of Adelaide St W, averaged 15 km/h with 743 vehicles an hour at 5:30 p.m. (from a single count, 2025).

THE RAMPS

The busiest segment of all has no speed

The busiest counted segment overall, the Lakeshore W / Gardiner ramp westbound (about 41,800 vehicles a day), was counted for volume only, so it is drawn as a band with no dots and no speed. Nothing is guessed.

INTERACTIVE

How to explore it

Three ways to see the street

Flow sends a dot for every 50 vehicles, Volume sizes each street by vehicles per hour, and Speed colours it by measured speed.

A day on a loop

Press Play to loop the typical weekday, jump to 7 a.m., Noon, 5 p.m. or Midnight, or play the whole day in 60 seconds.

Take the tour

The tour flies to the highlights and the key moments of the day, with a caption at each stop.

Open any street

Click a counted segment for its 24-hour chart, peak, speed through the day and rank, with a Jump to peak button.

Find a street

Type a street name to fly to its counted segments. Ctrl and scroll or pinch to zoom; Reset view puts everything back.

Keyboard and table

Every control works by keyboard, readings are announced, and the Table and CSV give every counted segment.

About the data

Every figure on this page is computed from the data in the visualization, and the visualization says plainly what is measured and what is modelled.

  • Source: City of Toronto Open Data, Transportation Services: "Traffic Volumes - Midblock Vehicle Speed, Volume and Classification Counts" (raw 15-minute rows) and "Toronto Centreline" (road geometry).
  • Contains information licensed under the Open Government Licence - Toronto.
  • A typical weekday, not a real day. The City counts each segment for 1 to 7 days at a time, on different dates. Each 15-minute value is the mean of every qualifying observation of that quarter-hour, across every count at that segment.
  • Counts taken in 2022 to 2026. 2020 and 2021 are excluded (pandemic traffic). Weekdays only; Ontario statutory holidays, their observed days and the Civic Holiday are excluded.
  • Flow is drawn only on counted segments: 145 segments and 273 directions from 229 counts. Nothing is interpolated for the grey, uncounted roads. 91 segments rest on a single count and are marked on the map.
  • Three expressway ramps were counted for volume only, so they carry no speed and no dots.
Have city data?

Traffic counts, transit, permits or service requests: we turn municipal data into maps residents and planners can explore, accessible to AODA / WCAG 2.1 AA. Tell us about your data.

More flows

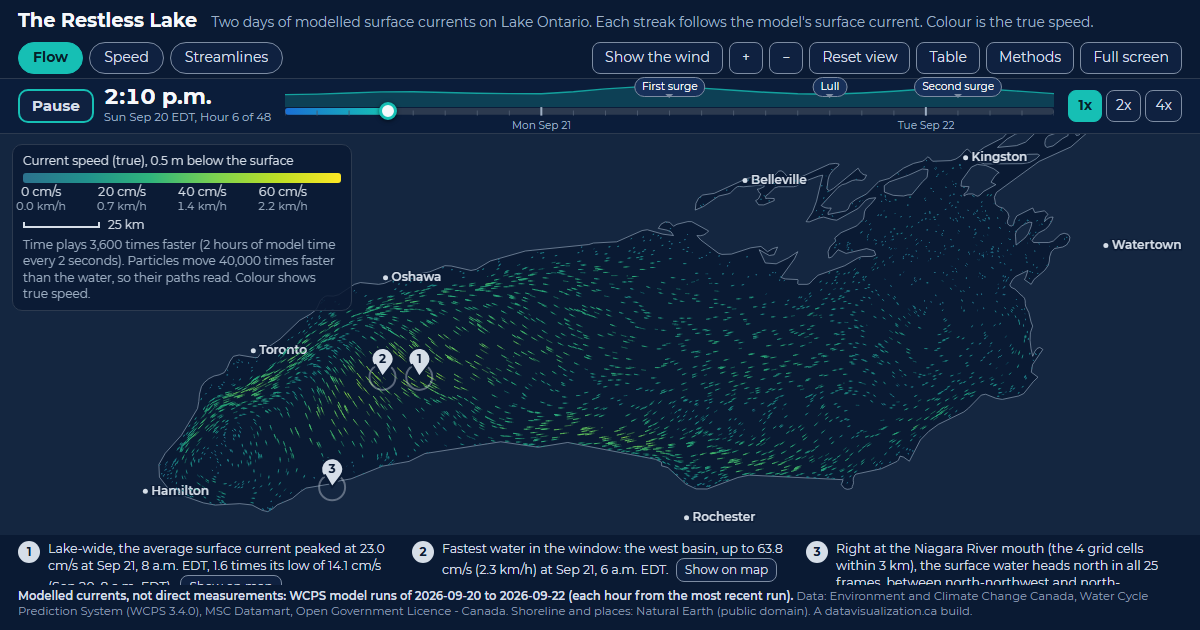
The Restless Lake: Lake Ontario filled with glowing streaks that follow the modelled surface current, coloured by speed.

The Restless Lake

Lake Ontario currents. 23.0 cm/s lake-wide average current at its peak, Sep 21, 8 a.m. EDT.

See the example

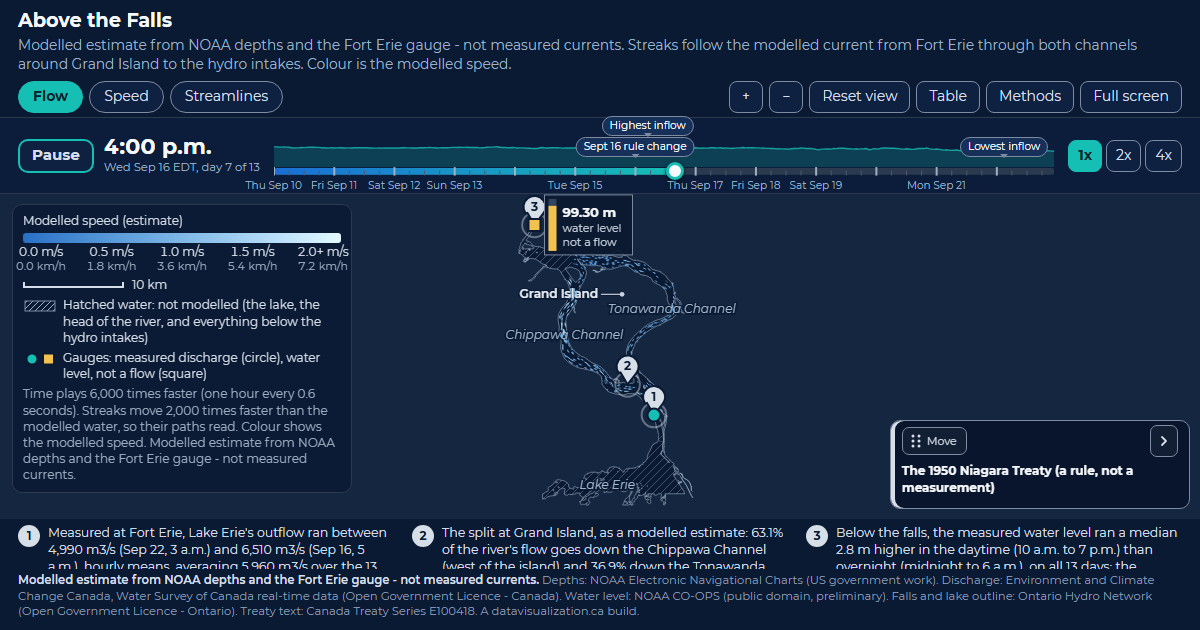
Above the Falls: the upper Niagara River with pale blue streaks splitting around Grand Island into the Chippawa and Tonawanda channels.

Above the Falls

Upper Niagara River. 5,960 m3/s Lake Erie's average measured outflow at Fort Erie over the 13 days.

See the example

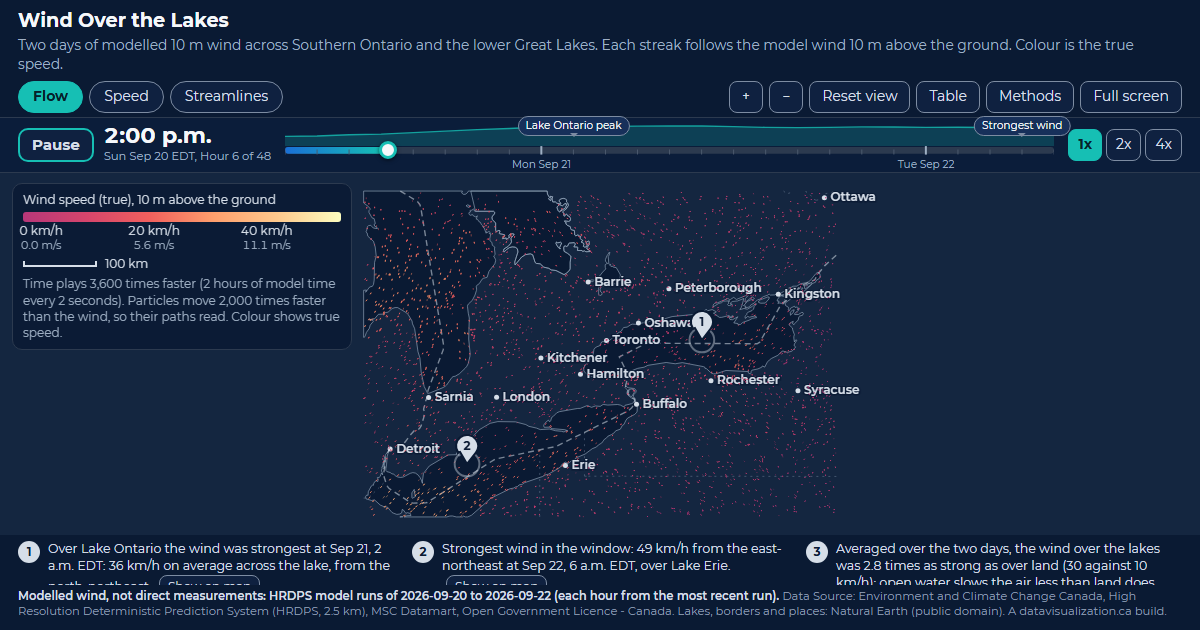
Wind Over the Lakes: Southern Ontario and the lower Great Lakes scattered with streaks that follow the modelled 10 m wind, coloured by speed.

Wind Over the Lakes

Southern Ontario wind. 49 km/h strongest wind in the window, over Lake Erie, Sep 22, 6 a.m. EDT.

See the example