Examples Tourism Muskoka tourism

CLIENT EXAMPLE - TOURISM

Muskoka tourism, mapped among its real lakes

There was no ready-made dataset, so we built one from the region's official tourism website: every place to stay, eat, explore and shop, structured into usable data and placed among Muskoka's real lakes.
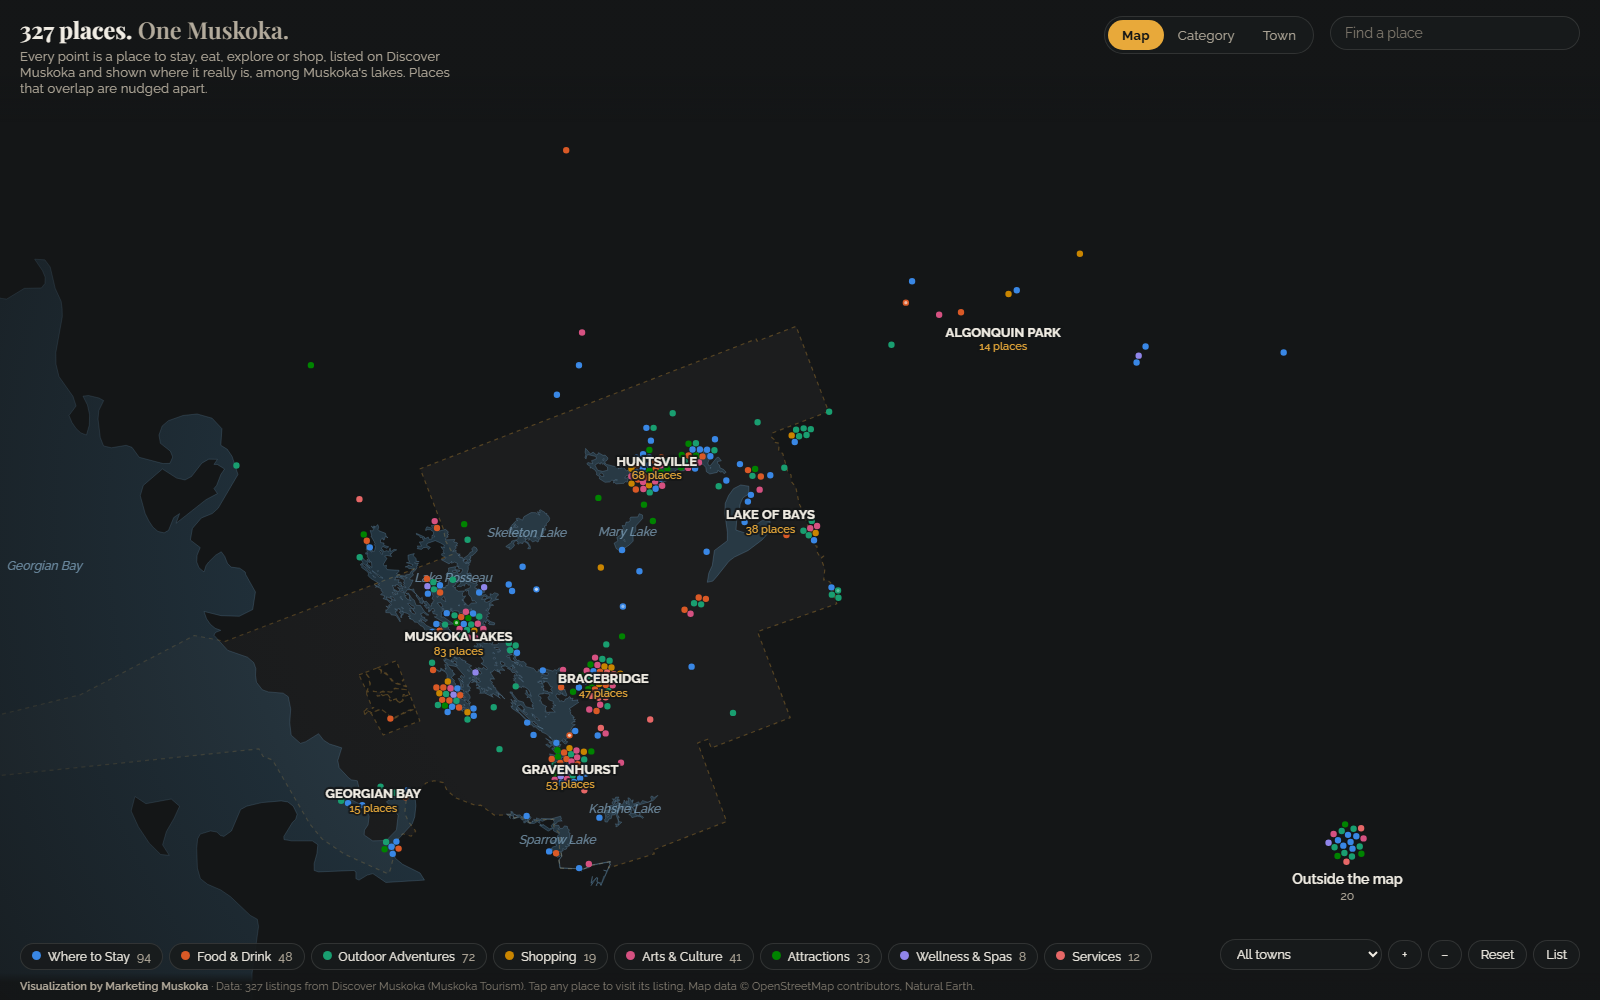
Map of Muskoka with coloured dots for tourism listings placed among the real lakes, grouped by town: Muskoka Lakes, Huntsville, Gravenhurst, Lake of Bays and more.

The live version runs on Marketing Muskoka's website.

327

tourism listings, one dot each

8

categories, from stays to spas

307

placed by their own coordinates

88%

of listings have a photo

What the data reveals

WHERE TO STAY LEADS

94 places to stay

Where to Stay is the biggest category: 94 of 327 listings (29%). Outdoor Adventures is next with 72 (22%), then Food and Drink with 48.

BUSIEST TOWN

Muskoka Lakes, with 83 listings

Then Huntsville (68), Gravenhurst (53), Bracebridge (47) and Lake of Bays (38). Switch to the Town view and the dots regroup to show it.

BUILT FROM A WEBSITE

No spreadsheet to start from

We collected the listings from the public website and placed each one at the coordinates published on its own listing page. Nothing was geocoded or guessed: the 20 listings without a coordinate are shown separately, outside the map.

INTERACTIVE

How to explore it

By category

Every place regroups by what it offers. Tap a dot to open its listing card.

By town

Each town becomes a ring showing the mix of what it offers.

Search

Find a specific place by name in seconds.

Every listing, as text

List view is a searchable table of every listing, usable with a keyboard and screen reader.

About the data

Source: 327 listings from Discover Muskoka (Muskoka Tourism), collected from the public listings. Map data: OpenStreetMap contributors and Natural Earth.

  • Each dot sits at the latitude and longitude published on its own listing page.
  • 20 listings have no published coordinate. They are shown separately, outside the map, and are still in the list.
  • Places that would overlap are nudged slightly apart so every one can be clicked.

Is your destination hiding in a directory?

Attractions, accommodations, dining and activities, together in one place that visitors and stakeholders can browse by category.

More examples

Map of Ontario made of dots, one for every Ontario Trillium Foundation grant since 1999, coloured by year. Southern Ontario is densest; 2,325 province-wide grants sit in a labelled group beside the map.

Ontario community grants since 1999

32,994 Ontario Trillium Foundation grants, one dot each, on the map of Ontario.

See the grants example

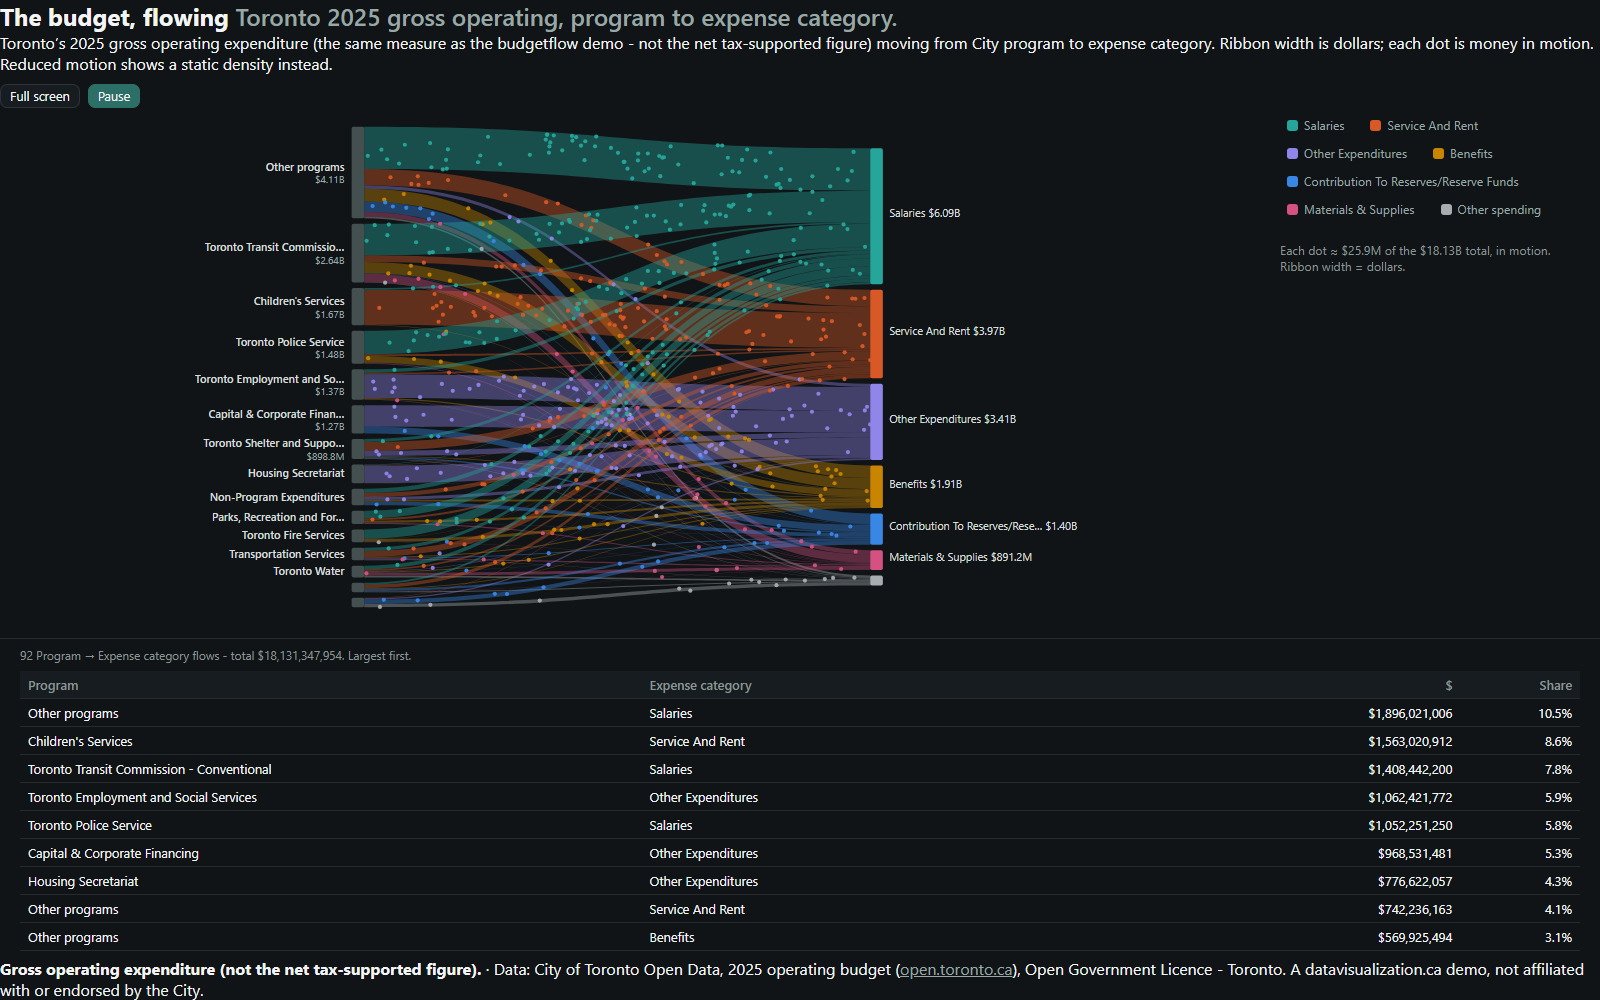
Flow diagram: Toronto's 2025 gross operating budget moving from 15 program groups on the left to 7 expense categories on the right. Salaries is the widest stream at $6.09B.

A city budget, in motion

Toronto's 2025 gross operating budget, flowing from City programs to what the money is spent on.

See the municipal example

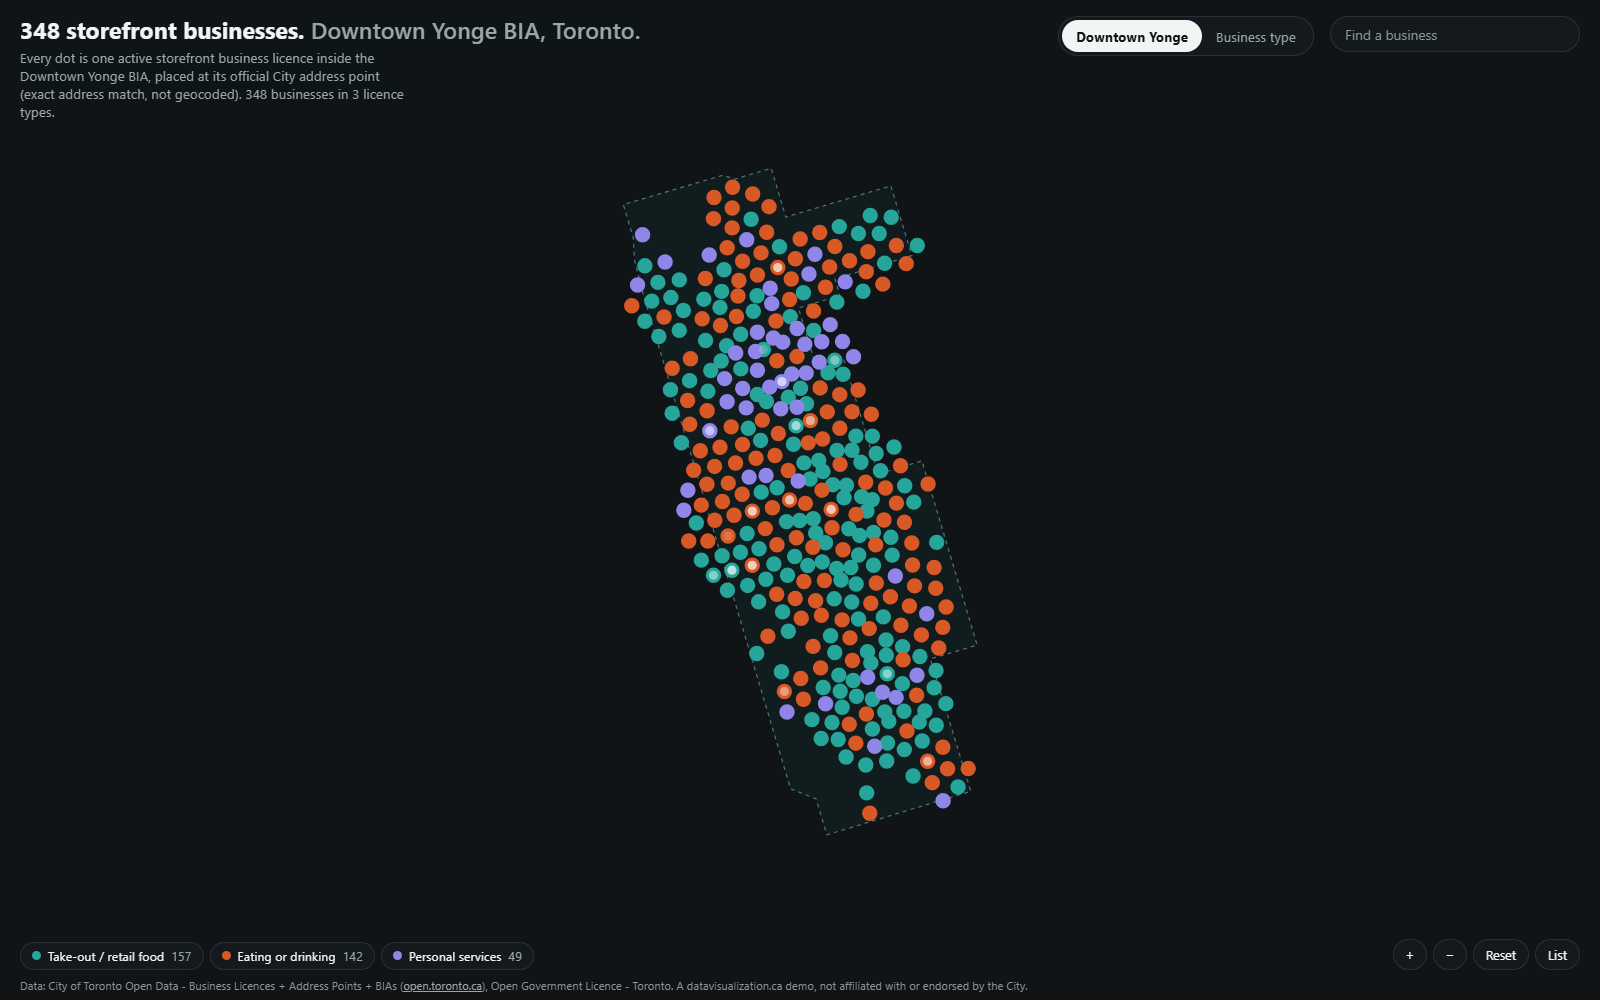
Map of the Downtown Yonge BIA boundary filled with 348 dots, one per storefront business, coloured by licence type.

Business Improvement Areas

348 storefront businesses in Toronto's Downtown Yonge BIA, each placed at its official City address.

See the BIA example