LIVE EXAMPLE - OPEN DATA
Toronto's grid, street by street
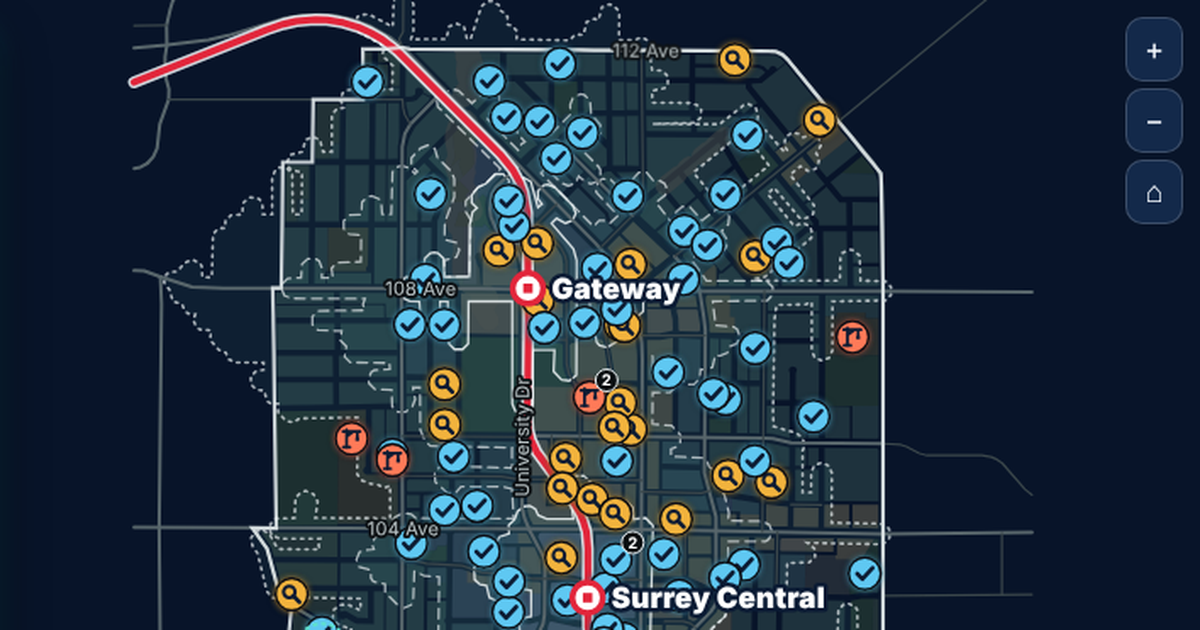
Every streetlight pole, active development application, City-run EV charger and street tree the City of Toronto has on record, mapped on its real streets and set against what Toronto Hydro announced in 2026. Four simple questions lead the way, each with a narrated 42 second tour.

Streetlight poles, active development applications, City-run EV chargers and street trees on City of Toronto streets and neighbourhoods. Data: City of Toronto Open Data, Open Government Licence - Toronto. Toronto Hydro figures from its public announcements. Narration voiced with ElevenLabs. Not endorsed by the City of Toronto or Toronto Hydro.
213,618
streetlight poles in the City's topographic mapping
4,439
active development sites, from 6,411 applications
117 of 158
neighbourhoods have no City-run EV charger
688,335
City street trees across 158 neighbourhoods
What the data reveals
INTERACTIVE
How to explore it
About the data
Every figure on this page and on the map is counted from the City of Toronto's published open data, and every Toronto Hydro figure links to its public source.
- Source: City of Toronto Open Data, pulled October 22, 2026, under the Open Government Licence - Toronto.
- Streetlights: Topographic Mapping - Poles, subtypes "Street Light Pole" and "Street Light and Traffic Signal Pole": 213,618 poles. Toronto Hydro reports 173,000 luminaires; the two inventories count different things.
- LED plan: the 2030 (60%) and 2035 (100%) milestones are Toronto Hydro and City targets. Years in between follow an even path, and which poles turn white first is illustrative, because the real conversion order is not public.
- Development: Development Applications (26,648 records). Active means not Closed, Refused, Inactive, Appeal Dismissed or OMB Refused: 6,411 applications on 4,439 sites. 108 active applications have no location and are not mapped. Applications within 3 m of each other are shown as one site. Coordinates are converted from NAD27 MTM zone 10 (EPSG:2019).
- Height and units are read from each application's own description where stated, and shown per site only, not as a city total.
- EV charging: City Operated Electric Vehicle Charging Station Map: 82 sites with 382 Level 2 and 23 Level 3 ports. It does not include every charger in the Green P network.
- Trees: Street Tree Data, 688,335 City-owned street trees, counted per neighbourhood.
- Roads, rail and hydro corridors: Toronto Centreline (TCL). Hydro towers are the "Circular Hydro Tower" subtype of the poles layer (376). Hydro corridors carry high-voltage transmission lines operated by Hydro One.
- Toronto Hydro figures (LED plan, September storm, demand forecast, connection times and EV charging) come from public announcements and reporting, linked in each panel of the map.
- Narration voiced with ElevenLabs.
- A one-page guide to every part of the map: Guide to the page (PDF).
- Not endorsed by the City of Toronto or Toronto Hydro.